Fig. 2.

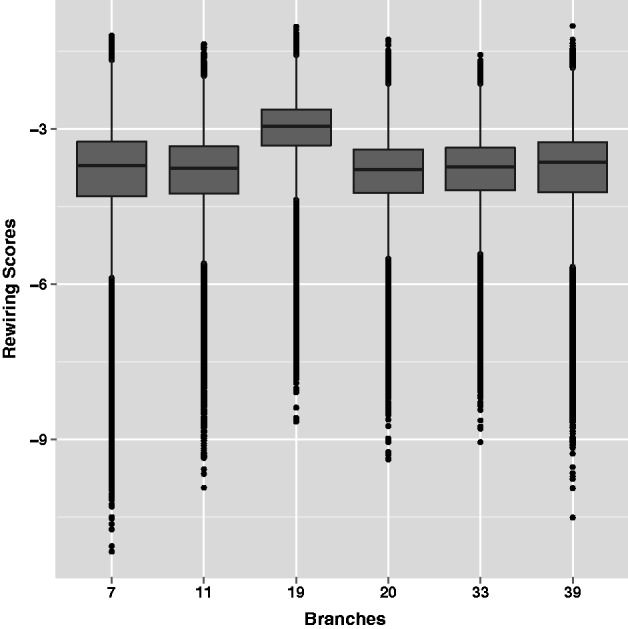
Distribution of all computed rewiring scores. Each boxplot here represents the distribution of RSs (log scale terms on the y-axis) across all triplets RS(X, Y, g), at a chosen branch b ϵ (7, 11, 19, 20, 33, 39) (shown on the x-axis).

Distribution of all computed rewiring scores. Each boxplot here represents the distribution of RSs (log scale terms on the y-axis) across all triplets RS(X, Y, g), at a chosen branch b ϵ (7, 11, 19, 20, 33, 39) (shown on the x-axis).