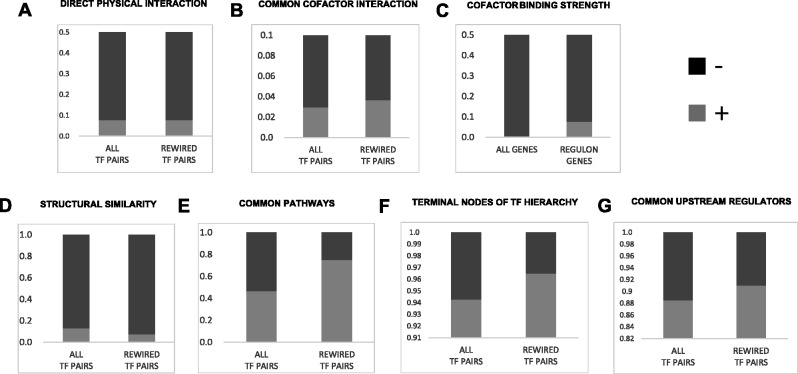
Fig. 7.
Functional analyses of rewired TFs in regulons. Each panel represents Fisher’s test of a specific hypothesis. In each case, rewired TF pairs and all other TF pairs are binned into two classes based on a given functional criteria (except panel C, where the bins are regulon genes and all other genes), and compared using Fisher’s exact test. (A) Direct physical interaction: Based on BioGRID database, the plot shows the fraction of TF pairs that do (light gray) and do not (dark gray) physically interact. (B) Physical interaction with a common cofactor TF: Based on BioGRID database, the plot shows the fraction of TF pairs that do (light gray) and do not (dark gray) possess a common cofactor TF. (C) Cofactor binding at target regulons: This plot shows the fraction of cofactor TFs that do (light gray) and do not (dark gray) bind strongly at gene promoters (≥0.75 vs. <0.75 binding scores). (D) Structural similarity: This plot shows the fraction of TF pairs that do (light gray) and do not (dark gray) belong to same structural family. (E) Common KEGG pathways: This plot shows the fraction of TF pairs that do (light gray) and do not (dark gray) belong to the same KEGG pathway. (F) TF hierarchy: This plot shows the fraction of TF pairs that do (light gray) and do not (dark gray) belongs to lowest and middle hierarchies. (G) Common upstream regulator: This plot shows the fraction of TF pairs whose distance to a common upstream regulator is ≤4 (light gray) or >4 (dark gray).

