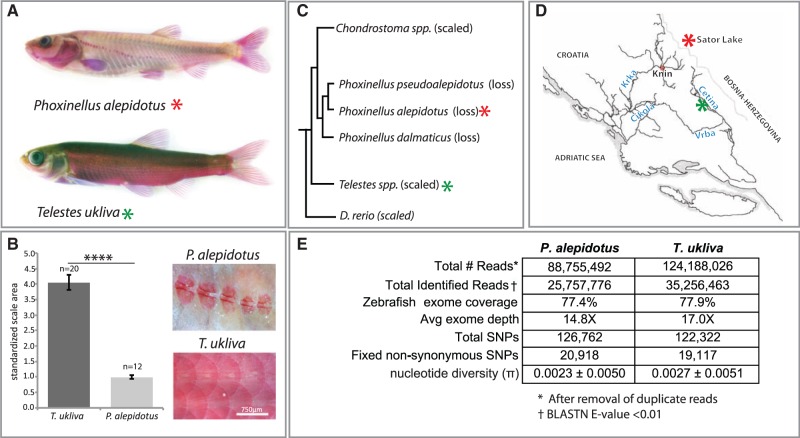
Fig. 2.
Comparative genomic analysis of scale reduction in natural populations. (A) Alizarin red stain of Phoxinellus alepidotus and Telestes ukliva highlighting loss of scales within Phoxinellus. (B) Average scale area relative to fish standard length. Data from three individuals of each species, with a total of n = 20 scales in T. ukliva and n = 12 scales in P. alepidotus. ****Two-tailed t-test P value < 0.0001. Error bars represent ±SEM. (C) Phylogenetic relationship between Phoxinellus and Telestes, with Danio rerio as the referenced outgroup used for analysis. Modified from (Perea et al. 2010) with addition of D. rerio. (D) Collection sites of P. alepidotus (red asterisk) and T. ukliva (green asterisk) used in this study. (E) Exome sequencing statistics from cross-species exome capture using zebrafish-targeted capture array. Single-end 100-bp Illumina HiSeq2000 reads were assembled using the Phylomapping pipeline.

