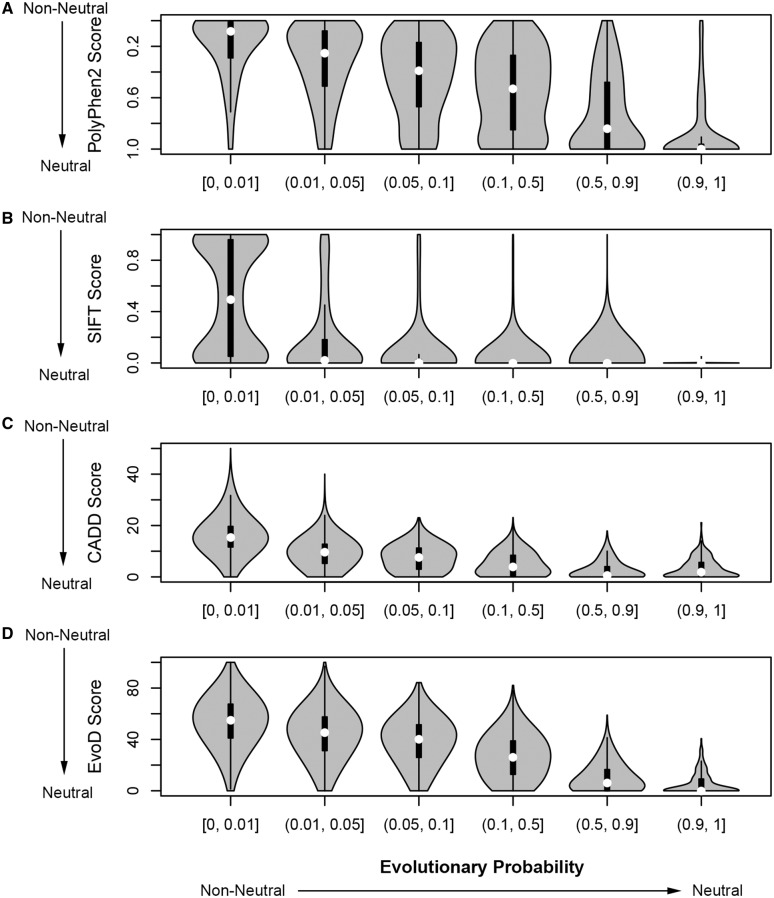
Fig. 6.
Relationship of EPs of human population polymorphisms with their impact scores produced by PolyPhen-2, SIFT, CADD, and EvoD. Using the 1KG data (1000 Genomes Project Consortium et al. 2012), 100,000 population polymorphisms were randomly selected. EPs and impact scores were calculated for minor alleles. Variants were grouped according to their EPs and violin plots produced to display the spread of impact scores from (A) SIFT, (B) PolyPhen-2, (C) CADD, and (D) EvoD. A violin plot displays the distribution of the impact scores for each group of variants; the white circle shows the median score and the black box shows the interquartile range.

