Figure 2.

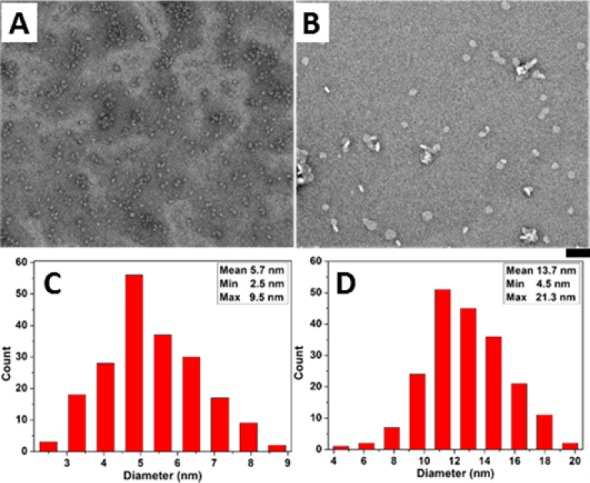
(A,B) TEM images of (A) 1a (100 μM); (B) 1a (100 μM) treated with ALP (1 U/mL) in PBS (pH7.4) after 24 h; bar is 50 nm. (C,D) Histogram of the size of oligomers (according to TEM, for 200 particles) in (C) A and (D) B.

(A,B) TEM images of (A) 1a (100 μM); (B) 1a (100 μM) treated with ALP (1 U/mL) in PBS (pH7.4) after 24 h; bar is 50 nm. (C,D) Histogram of the size of oligomers (according to TEM, for 200 particles) in (C) A and (D) B.