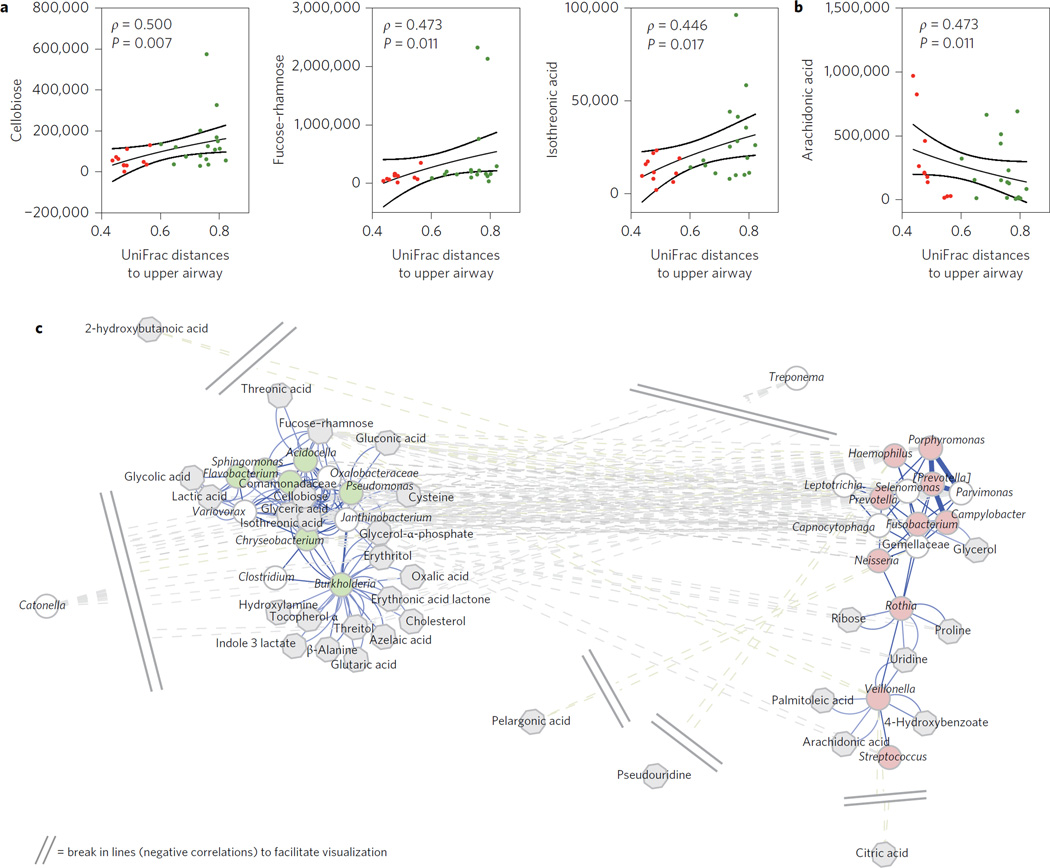
Figure 3. Correlation between the lower airway microbiome and metabolome.
a,b, Average UniFrac distances between pairs of BAL samples and upper airways was positively (a) or negatively (b) correlated with levels of metabolites in BAL fluid. Red symbols represent BAL samples identified as pneumotypeSPT and green symbols represent BAL samples identified as pneumotypeBPT (lines represent medians and standard error, SE, P values are based on Spearman’s ρ). c, A co-occurrence network for genus-level summarized taxa was built using SparCC as described in the Methods. Genera (circles) were then correlated with levels of metabolites, and significantly correlated metabolites (grey octagons) are represented in the network. Genera identified as markers for pneumotypeBPT are in light green and genera identified as markers for pneumotypeSPT are in light red. Cytoscape 3.2.158 was used to visualize the network with a prefuse force-directed layout, with the length of edges being 1 – ρ for positive correlations and absolute (ρ) for negative correlations. Nodes in close proximity are therefore highly positively correlated, and nodes further apart are highly negatively correlated.

