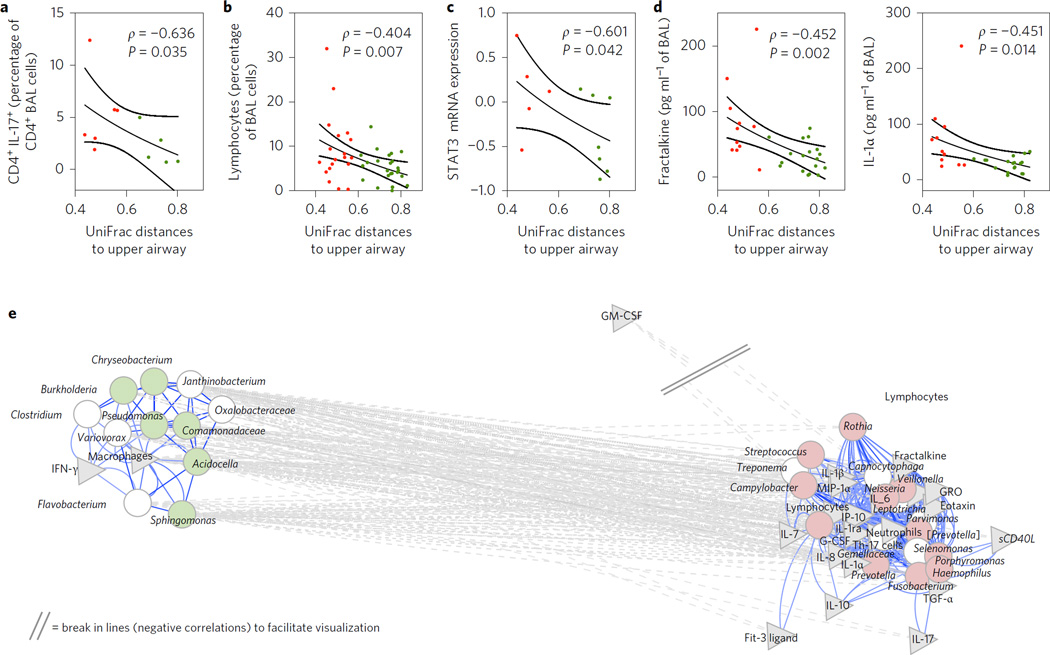
Figure 4. Similarity of the lower airway microbiome with the upper airway microbiome is associated with the percentage of lymphocytes in BAL.
a,b, Average UniFrac distances between pairs of BAL samples and upper airways were negatively correlated with the percentage of CD4+ IL17+ cells (a) and the percentage of lymphocytes (b) in BAL. c, Similarity of the lower airway microbiome with the upper airway microbiome is associated with increased expression of STAT3 mRNA in bronchial epithelial cells. d, Negative significant correlations were found between average UniFrac distances of BAL to the upper airway and fractalkine and IL-1α. Red symbols represent BAL samples identified as pneumotypeSPT and green symbols represent BAL samples identified as pneumotypeBPT (lines represent median and SE, P value based on Spearman’s ρ). e, Network analysis built around co-occurrent taxa as defined previously (see Fig. 3). Taxa (circles) remaining in the model were then correlated with levels of cells and cytokines in BAL (grey triangles). Genera identified as markers for pneumotypeBPT are shown in light green and genera identified as markers for pneumotypeSPT are shown in light red. Significant correlations are shown in the network. The network was visualized with Cytoscape with the same parameters as previously defined. GM-CSF, granulocyte-macrophage colony-stimulating factor; G-CSF, granulocyte colony-stimulating factor; GRO, growth-related oncogene-α.

