
Fig. 3. Antibiotics can both promote and suppress conjugation dynamics.
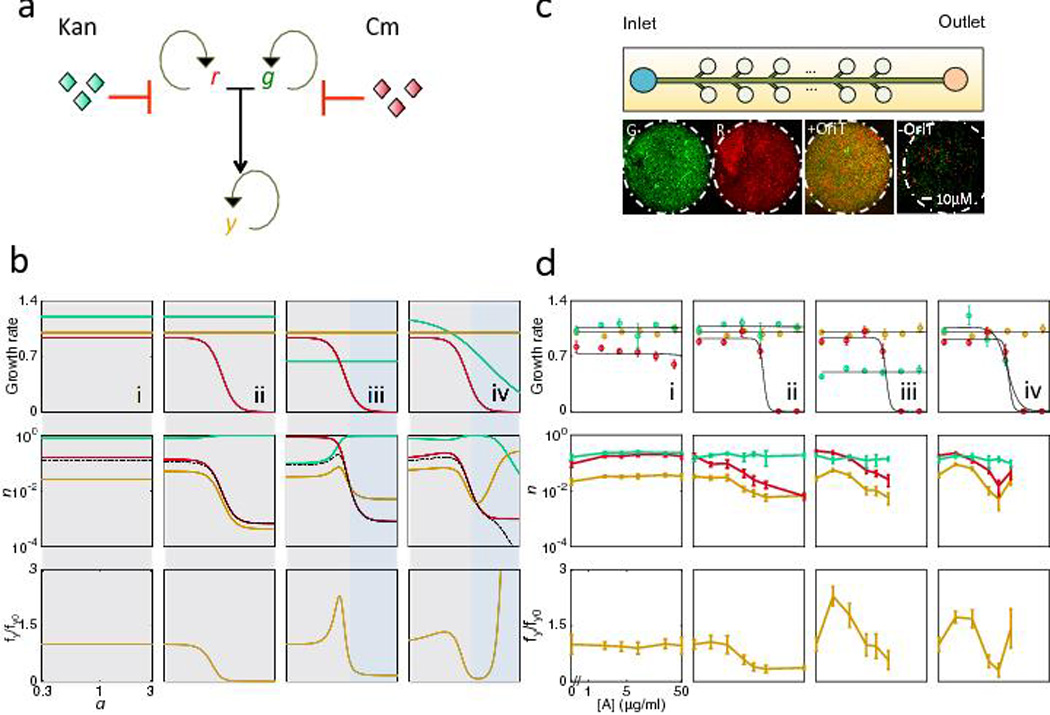
(a) Conjugation dynamics of r (recipient), g (donor), and y (transconjugant) in response to antibiotics, which can alter the growth rates of one or more of the three populations. Curved arrows represent cell proliferation, and blunt ended arrows represent antibiotic inhibition. r and g conjugate to form y.
(b) Model (Eq. 1–3) predictions of conjugation dynamics dependence on antibiotic concentration (a) for all four trends. Top row: Growth rates for the three populations. Middle row: Total density (n) of r, g, and y after 16 arbitrary time units (A.U.) Bottom row: fy normalized by fy at a = 0 (fy0). Dashed line indicates contribution through conjugation (rg). Shaded boxes outline regions of similar dynamics. (i) Antibiotic has no effect on either parent. (ii and iii) Antibiotic inhibits only one parent. (iv) Antibiotic inhibits both parents.
(c) Microfluidic platform to quantify conjugation. The microfluidic chip contains cell-trapping chambers, which allow for monolayer bacterial growth (See Fig. S5a and Methods for device details). 8–10 chambers are measured per growth condition per experiment. Each population is determined by obtaining the total pixel number of R (mCherry), G (GFP) and Y (colocalization algorithm)44, and normalized by the carrying capacity of the chamber (Nm=6×105 pixels/chamber), to obtain r, g, and y respectively. Representative images (from 10 replicates) show pure G+ and R− populations, and mixed populations with or without oriT (See Methods).
(d) Experimental results confirmed model predictions in (b). Panel numbers correspond to those in (b). Standard deviation was from 8–10 chamber replicates, with those falling outside of two standard deviations or having lost focus removed. (i) Rk and G+ are both resistant to Kan, and x-axis is Kan. (ii) R− and G+ are resistant to Cm and Kan respectively, and x-axis is Kan. (iii) Same as (ii), with 4µg/mL Cm to reduce G+ growth rate. (iv) R− and G+ are resistant to Cm and Kan respectively, and x-axis is both Cm and Kan. Top row: growth rates for the three populations quantified using plate reader measurements (see Methods). Middle row: the total density (n) of r, g, and y after 12 hours of growth. Bottom row: fy normalized by fy at [A] = 0, fy0 (see Table S5).