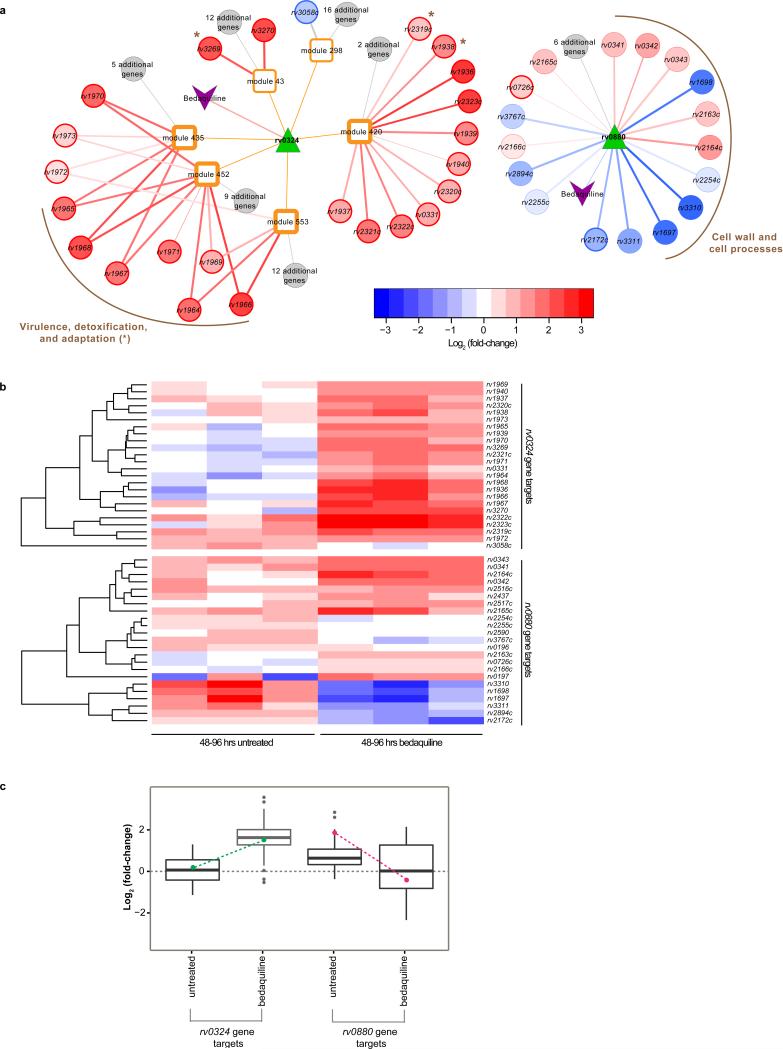
Figure 1. Bedaquiline response networks regulated by rv0324 and rv0880.
(a) Graphic representation of linkages between bedaquiline treatment, rv0324, and modules of co-regulated genes (left); and a network view of the rv0880 bedaquiline-response regulon (right). The color scale of regulatory targets represents log2 fold-change values. The edge width is scaled based on Benjamini Hochberg adjusted P-values from t-test comparison of log2 fold-change values of bedaquiline treated and untreated controls. Darkened borders indicate genes that were experimentally validated as functional targets of rv0324 or rv0880. Darkened borders of modules 420, 435, 452 and 553 indicate significant enrichment in bedaquiline-response genes (Benjamini Hochberg adjusted P-value < 0.01). The genes of the rv0324 regulon belonging to the TubercuList category12, ‘virulence, detoxification, and adaptation’ (Benjamini Hochberg adjusted P-value = 3.5 × 10⁻⁸) are grouped together as are the genes of the rv0880 regulon from the ‘cell wall and cell processes’ TubercuList category (Benjamini Hochberg adjusted P-value = 1.9 × 10⁻³). (b) The heat maps show the log2 fold-change of rv0324 regulatory targets (top) and rv0880 (bottom) regulatory targets for untreated and 48-96 hours of bedaquiline treatment from three biological samples. The color scale represents log2 fold-change values. (c) The box plots show average log2 fold-change for rv0324 and rv0880 gene targets for untreated and 48-96 hours of bedaquiline treatment from three biological samples. The box plots are overlayed with log2 fold-change values for rv0324 (green points) and rv0880 (magenta points).

