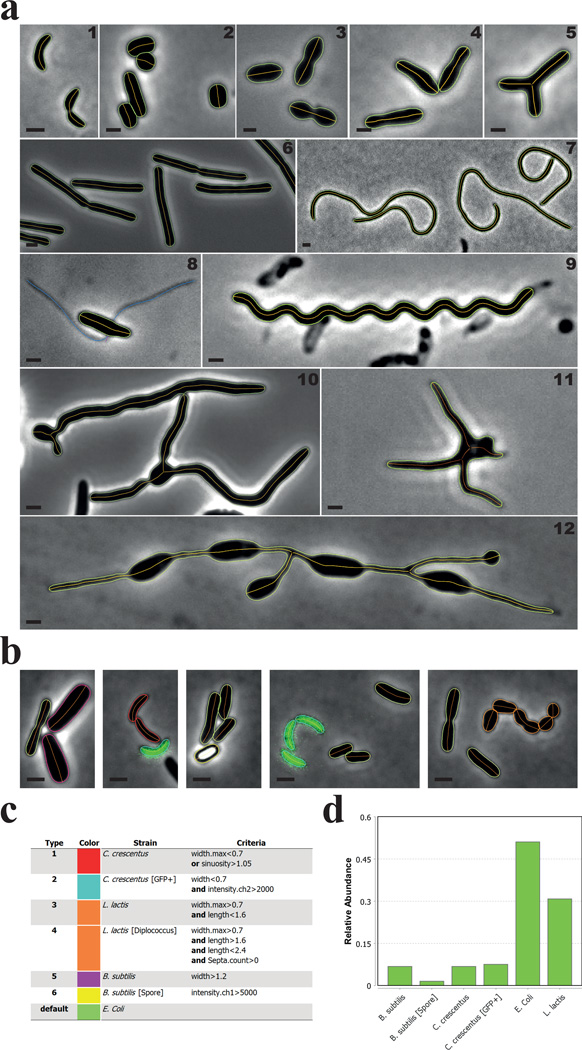
Figure 2. MicrobeJ can detect various cell morphologies.
(a) Representative phase contrast images of (1) C. crescentus cells, (2) Streptomyces venezuelae cells, (3) Streptococcus pneumoniae cells, (4) Rhodopseudomonas palustris cells, (5) Agrobacterium tumefaciens branched mutant cells, (6) Bacillus subtilis cells, (7) Cephalexin-treated C. crescentus cells, (8) Asticcacaulis biprosthecum cells, (9) 2 week old, viable, late stationary phase-adapted C. crescentus cells, (10) Vegetative S. venezuelae cells, (11) long-stalked morphotype Prosthecomicrobium hirshii cells, and (12) Rhodomicrobium sp. cells. The bacterial cell contours (green) and their corresponding medial axes (orange) are shown. A. biprosthecum stalks, detected and associated with the cell using the filament detection option, are shown in blue (8). Scale bar = 1µm. (b–d) In this experiment, C. crescentus CB15 cells (red contours), C. crescentus cells expressing a cytoplasmic GFP (mini-Tn7(Gm)gfp) (cyan contours), B. subtilis vegetative cells (magenta contours), B. subtilis spores (yellow contours), Lactococcus lactis cells (orange contours), and Escherichia coli MG1655 cells (green contours) were mixed together and imaged on an agarose pad. Cellular types were defined using the morphological and signal properties based on the specified criteria (c). The relative abundance of each type is shown (d).

