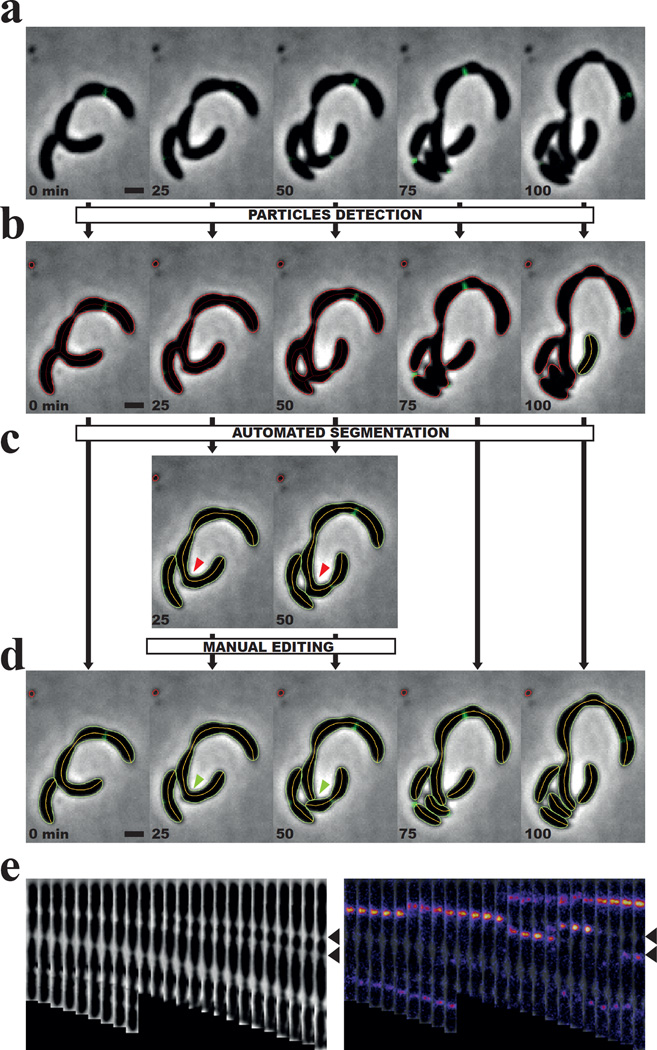
Figure 4. The automated and manual segmentation processes.
(a–d) Sequence of representative phase contrast images showing several rounds of division from a group of C. crescentus cells harboring division defects. Time points are indicated for each time frame (Scale bar = 1 µm). (b–d) The particle contours computed by MicrobeJ at different steps of the segmentation process: before the automated segmentation process (b), after the automated segmentation process (c), and after the manual correction (d). Rejected particles are shown in red, while accepted particles are shown in green. (c) For clarity, the phase contrast images and their respective particle contours that did not require manual correction, were hidden. The red arrows highlight the cell that needed manual segmentation. (d) The green arrows highlight the result of the manual segmentation. (e) A montage of straightened phase contrast images (left panel) and fluorescence overlays showing the dynamic localization of FtsZ-YFP in a filamentous cell over time. Pictures were taken every 5 min. Black arrows highlight the two constrictions where FtsZ-YFP localizes alternatively until the cell divides.

