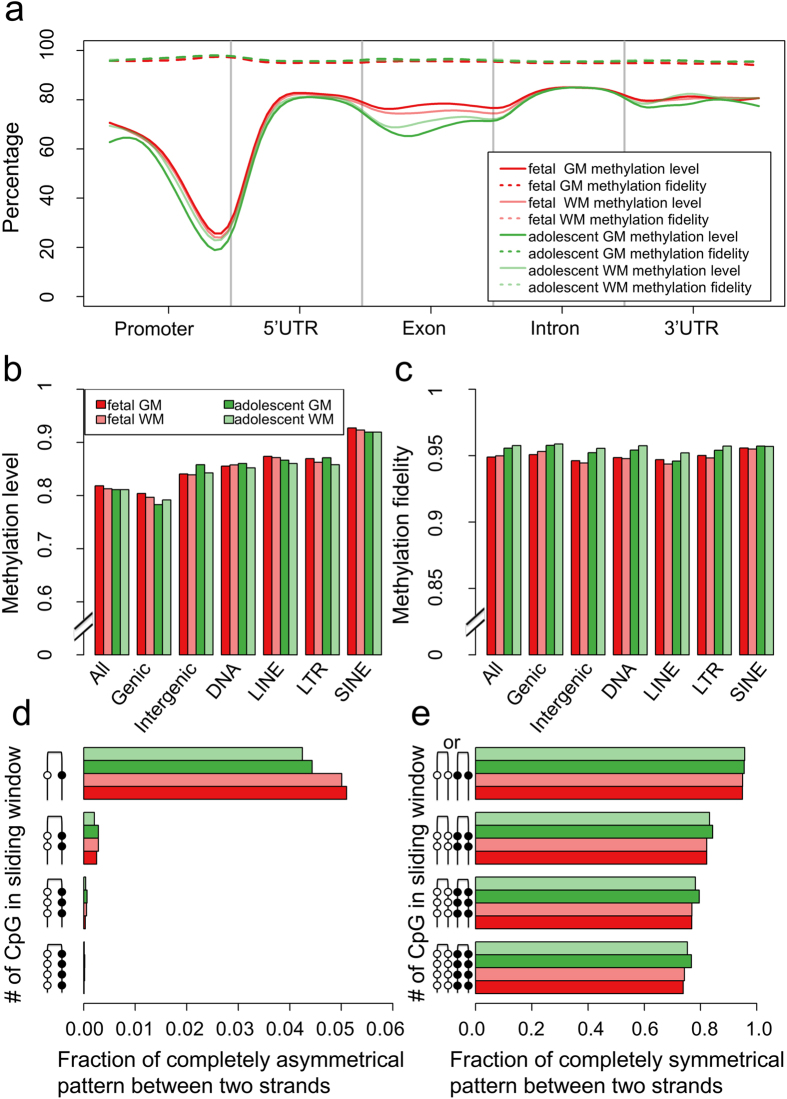
Figure 2. Hairpin bisulfite sequencing for human fetal and adolescent brains.
(a) Methylation level and fidelity along different gene-associated regions. Each genomic region was divided into 20 equal-sized bins. The smoothed lines represent the mean methylation level (solid lines) and methylation fidelity (dashed lines). (b) Methylation level in different genomic regions. (c) Methylation fidelity in different genomic regions. (d) Fraction of bipolar methylation pattern using different sliding windows. (e) Fraction of symmetrical (un)methylation pattern using different sliding windows. GM and WM represent gray matter and white matter, respectively.

