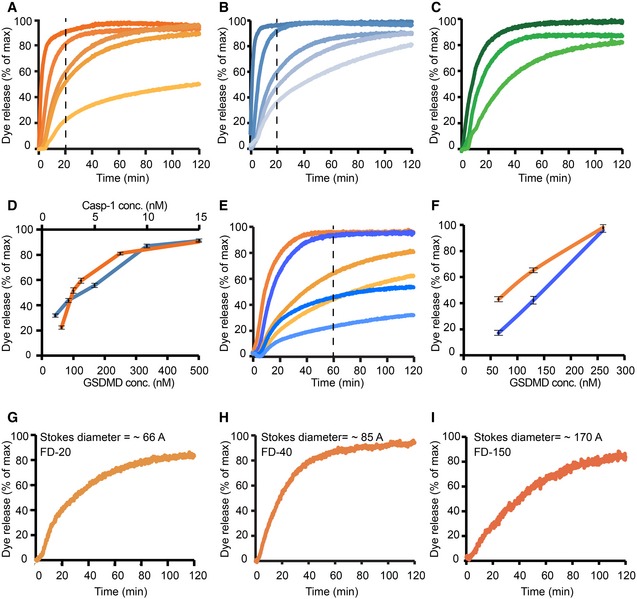
Dye release time courses from liposomes as a percentage of maximal release. (A) Five different reactions, where 5 nM caspase‐1 and 400 μM 6‐carboxyfluorescein‐loaded liposomes prepared with
E.
coli polar lipids were incubated with GSDMD concentrations of (nM): 520, 260, 130, 100, 65 (colored dark to light orange). The time point of 20 min is highlighted by a vertical dashed line. (B) Five different reactions, where 130 nM of GSDMD and 400 μM 6‐carboxyfluorescein‐loaded liposomes prepared with
E.
coli extract polar lipid, were incubated with caspase‐1 concentration of (nM): 15, 8, 5, 2.5, 1.2 (colored dark to light blue). The time point of 20 min is highlighted by a vertical dashed line. (C) Three different reactions, where 5 nM caspase‐1 and 400 μM 6‐carboxyfluorescein‐loaded liposomes prepared with porcine brain total lipid extract, were incubated with GSDMD concentrations of (nM): 520, 260, 100 (colored dark to light green). (D) Dye release at 20‐min reaction as a function of GSDMD (dark orange) and caspase‐1 (dark blue) concentrations. Error bars for three independent experiments are shown. (E) Two different sets of reactions, where wild‐type GSDMD (dark to light orange) and the mutant GSDMD
I104N (dark to light blue) were independently incubated at the concentrations of 260, 130, and 65 nM with 5 nM caspase‐1 and 400 μM 6‐carboxyfluorescein‐loaded liposomes. The time point of 60 min is highlighted by a vertical dashed line. (F) Dye release at 60 min of reaction as a function of GSDMD wild‐type (dark orange) and GSDMD
I104N (dark blue) concentration. Error bars for three independent experiments are shown. (G–I) Dye release from 400 μM liposomes loaded with the 6‐carboxyfluorescein derivates FD‐20, FD‐40, and FD‐150, with variable Stokes diameters, as indicated. 130 nM of GSDMD and 5 nM caspase‐1 were incubated with the liposomes. For each experiment, a representative from three independent experiments is shown. The corresponding raw data are shown in
Appendix Figure S5.