
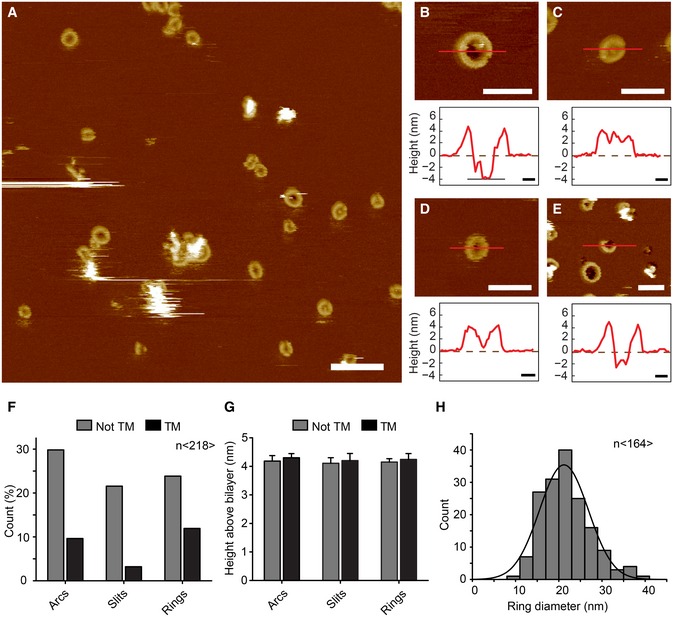
Figure 6. Characterization of GSDMD Nterm pores by atomic force microscopy.
-
AAFM topograph of GSDMDNterm bound to lipid membranes of E. coli polar lipids. Overview topograph showing arc‐, slit‐, and ring‐like GSDMD oligomers. Scale bar corresponds to 100 nm.
-
B–EHigh‐resolution AFM topographs and height profiles of GSDMDNterm oligomers (red curves). Height profiles were measured along the red lines in the topographs. Dashed zero lines (0 nm) indicate the surface of the lipid membrane; heights of < −4 nm indicate that the oligomers formed transmembrane pores. Topographs were taken in buffer solution (150 NaCl, 20 mM Hepes, pH 7.8) at room temperature. The experiment was reproduced at least three times using independent liposome and GSDMD preparations. Scale bars of topographs correspond to 50 nm and of height profiles 10 nm. The full color range of the AFM topographs corresponds to a vertical scale (height) of 20 nm.
-
F–HAnalysis of GSDMDNterm oligomers bound to lipid membranes of E. coli polar lipids. (F) GSDMDNterm oligomers assembled into arcs, slits, and rings leading to transmembrane (TM) pores or not transmembrane aggregate (n = 218). (G) Height of GSDMDNterm oligomers protruding from the lipid membrane. Bars represent mean, and error bars represent s.e.m. (n = 218). (H) Distribution of the diameters of rings formed by GSDMDNterm oligomers. The average distribution was 21.2 ± 5.6 nm (n = 164; average ± s.d.), and the bin size was 3 nm.