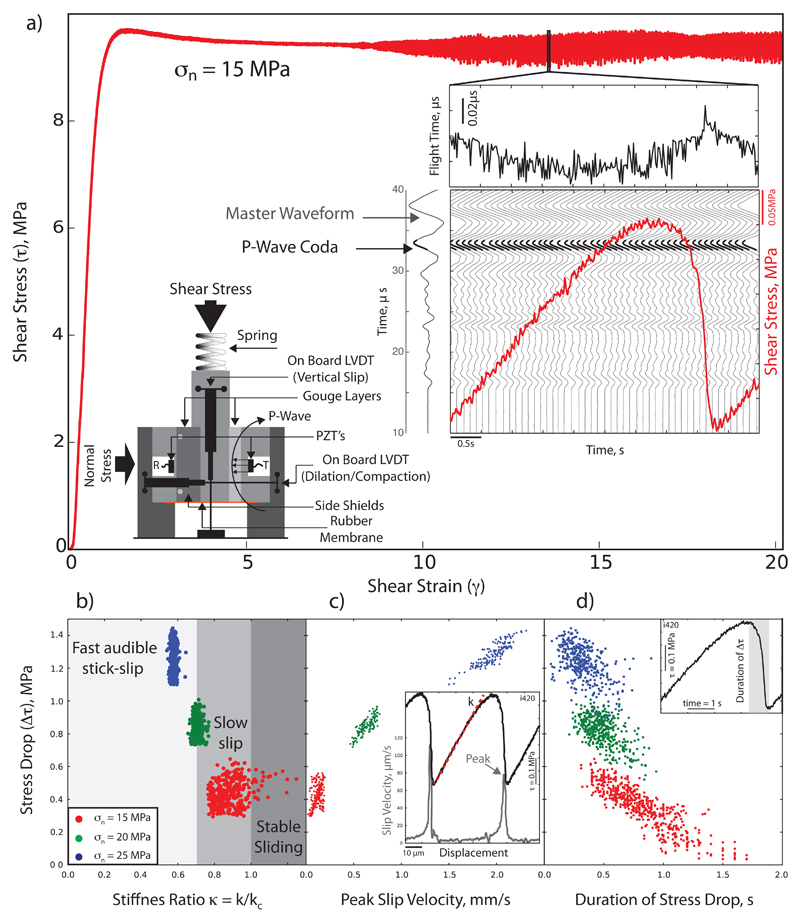
Figure 1. The spectrum of fault slip behaviour for laboratory faults.
(a) Representative experiment at σn=15 MPa. Left inset shows the double direct shear configuration. Right inset shows details for a slow-slip event (red) with associated recorded seismic waveforms (grey) and the corresponding variations in flight time (top). The stiffness ratio, K, controls the transition from slow to fast stick-slip as mapped in the stability phase diagram (b), the peak slip velocity (c), and the slip event duration (d). Inset in panel (c) shows the linear fit (red dashed line) to the shear stress-displacement curves (black) used to obtain k, and slip velocity (grey). Inset in panel (d) shows a failure event and the duration of the stress drop.

