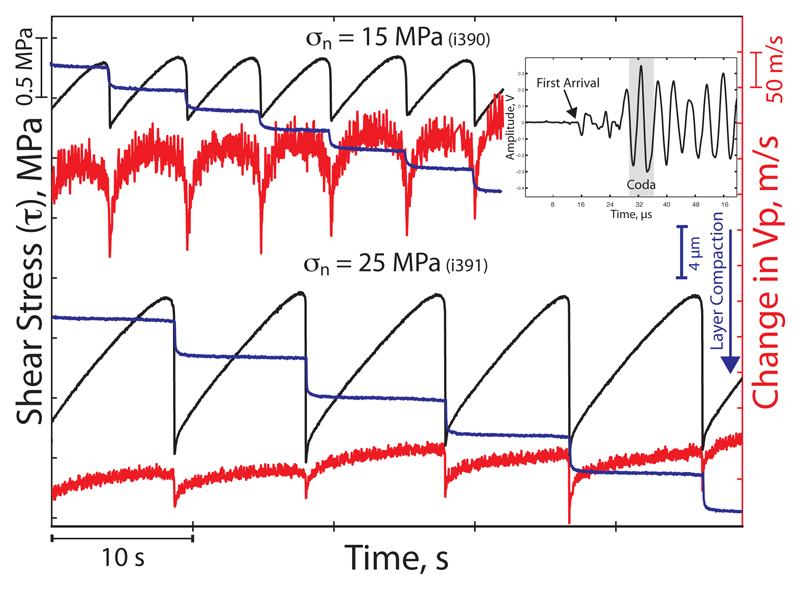
Figure 2. Mechanical and P-wave velocity measurements during slow-slip (top) and fast-slip cycles (lower curves).
Data showing the evolution of shear stress (black), layer thickness (blue) and changes in P-wave velocity (Vp) (red) during slow (top set of curves) and fast (lower curves) stick-slip events. Inset shows a typical waveform with the P-wave arrival and the P-coda used to calculate Vp (see Fig. Supplementary 4 and methods for additional details). Note the consistency in the Vp evolution during the slow and fast stick-slip cycles, mimicking the evolution of shear stress.

