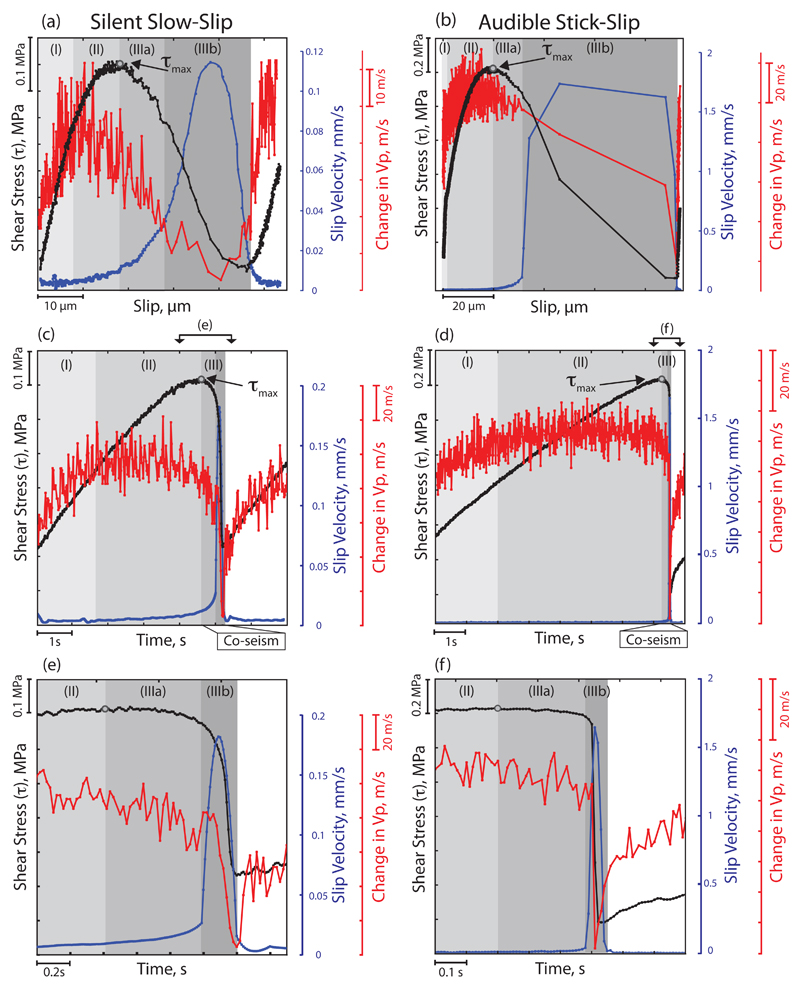
Figure 3. Comparison between slow slip and fast stick-slip cycles.
Details of slow (left column) and fast (right column) stick-slip events. (a, b) Representative slip events taken at shear displacement of 25 mm, and (c, d, e, f) at displacement of 30 mm. The evolution of shear stress (black), slip velocity (blue) and P-wave velocity (red) is shown as a function of: (a, b) fault slip and (c, d, e, f) time. The grey shaded boxes indicate the three phases of the seismic cycle: (I) inter-seismic, (II) pre-seismic and (III) co-seismic, as described in the text.

