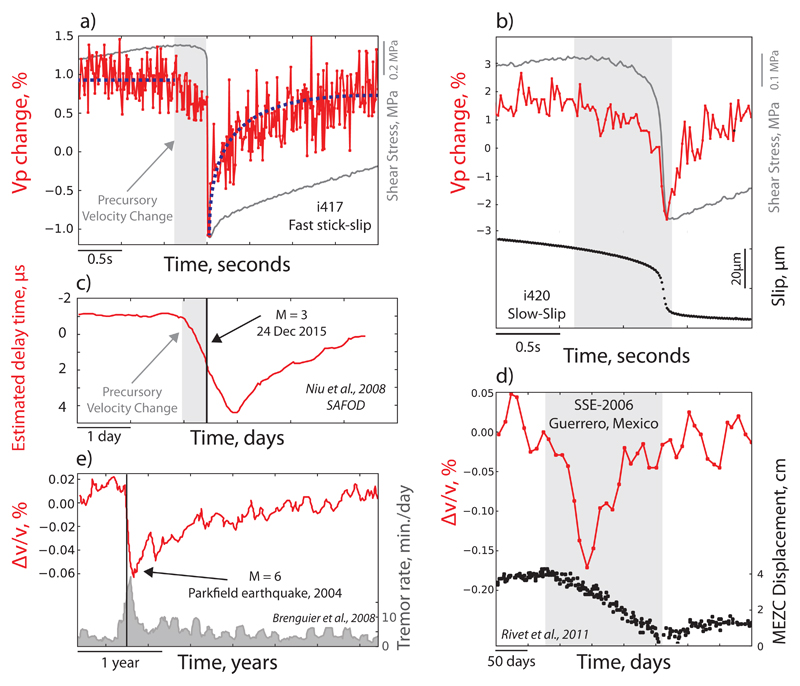
Figure 4. Comparison between laboratory and natural variation in seismic velocity.
Seismic velocity changes during the earthquake cycle for fast (a) and slow (b) laboratory earthquakes and fault slip events in nature ranging from typical earthquakes (c and e) to slow-slip events (d). Grey shaded bands in (b) and (d) represent slow-slip events in the lab and in nature.

