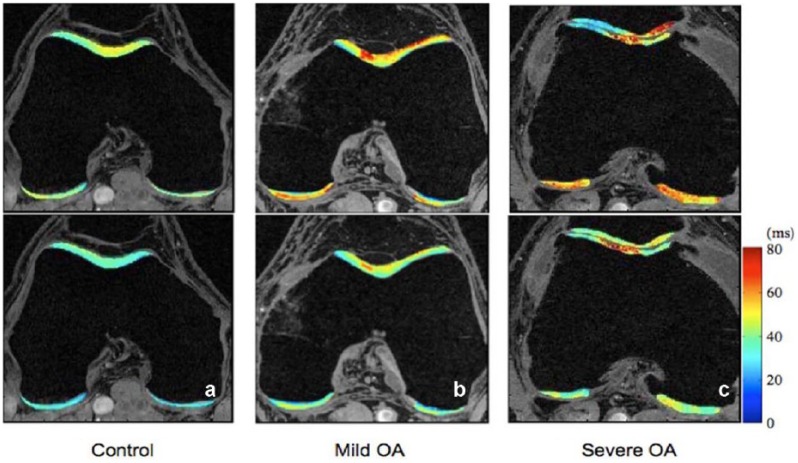
Figure 1.
T1ρ and T2 maps of (a) a healthy control, (b) a subject with mild osteoarthritis (OA), and (c) a subject with severe OA. Significant elevation of T1ρ and T2 values were observed in subjects with OA. T1ρ and T2 elevation had different spatial distribution and may provide complementary information associated with cartilage degeneration. Reprinted with permission from Li and Majumdar.59

