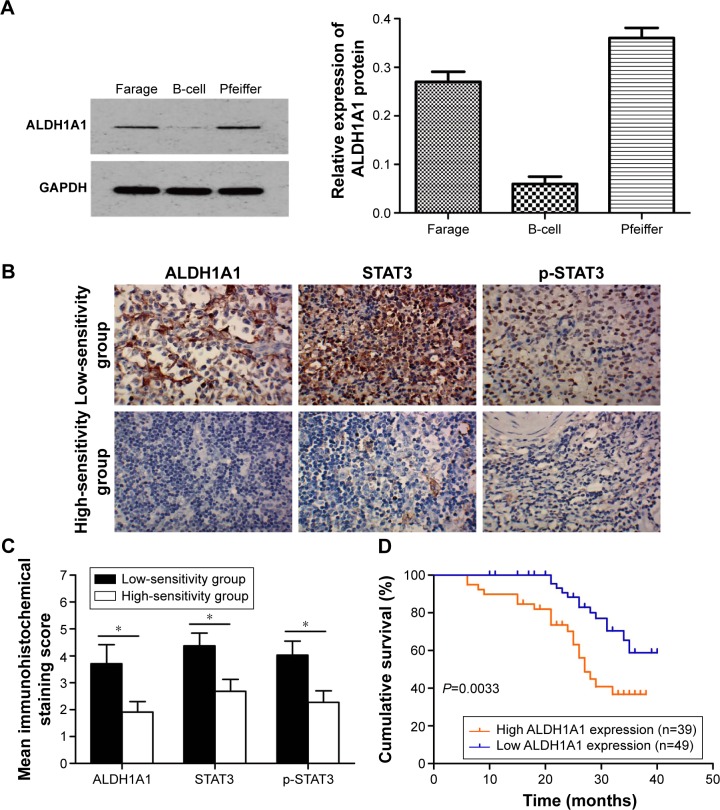
Figure 1.
ALDH1A1 expression in DLBCL cell lines and clinical specimens.
Notes: (A) The levels of ALDH1A1 protein were quantified using Western blot in two DLBCL cell lines (Farage and Pfeiffer). GAPDH blotting was used as a loading control. Bar graphs are derived from densitometric scanning of the blots. The density of the ALDH1A1 blot was normalized against that of GAPDH to obtain a relative blot density. Bars are mean ± SD from three independent experiments. (B) Representative images of ALDH1A1, STAT3, and p-STAT3 immunohistochemical staining in low sensitivity group and high sensitivity group DLBCL patients (magnification: 200×). (C) Mean immunohistochemiscal staining scores for ALDH1A1, STAT3, and p-STAT3 in low-sensitivity group and high-sensitivity group DLBCL patients. *P<0.05. (D) The comparison of overall survival between patients with high ALDH1A1 expression and low ALDH1A1 expression. Patients with low expression of ALDH1A1 had a longer survival than those with high expression (log-rank test, P=0.0033).
Abbreviations: ALDH1A1, aldehyde dehydrogenase 1A1; GAPDH, glyceraldehyde 3-phosphate dehydrogenase; SD, standard deviation; DLBCL, diffuse large B-cell lymphoma; p-STAT3, phosphorylated-STAT3.

