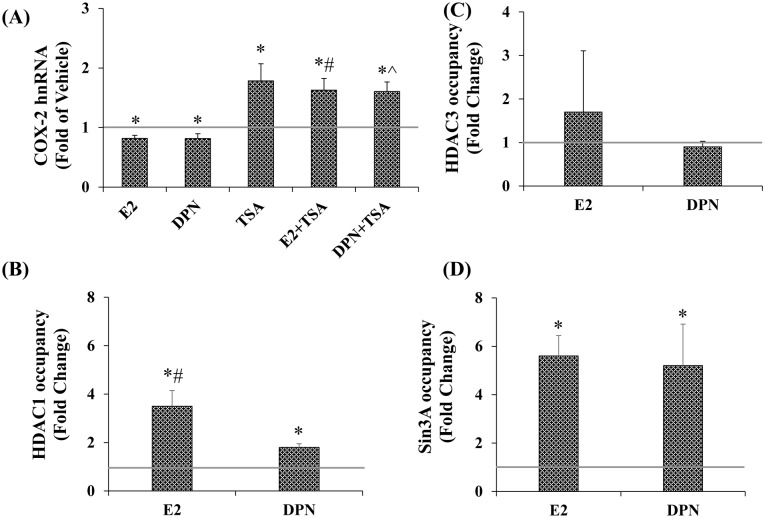
Fig 5. Deacetylation plays a role in E2 and DPN repression of basal.
A, TSA increases COX-2 hnRNA. Cells were treated for 24 hrs with E2, DPN, TSA (100nm) or E2+TSA and DPN+TSA. ChIP analyses were performed for B, HDAC1 (Abcam), C, HDAC3 (Cell Signaling), and D, Sin3A (Sigma-aldrich). (n≥3). Data represents mean ± SEM and is expressed as fold of VEH. A, (*) p = 0.007 for E2, p = 0.050 for DPN, p = 0.025 for TSA p = 0.013 for E2+TSA, p = 0.005 for DPN+TSA. (#) p = 0.004 E2+TSA compared to E2, (^) p = 0.003 DPN+TSA compared to DPN. B, (*) p = 0.008 E2, p = 0.002 DPN compared to VEH. (#) p = 0.04 E2 compared to DPN. D, (*) p = 0.002 E2, p = 0.048 DPN compared to VEH.

