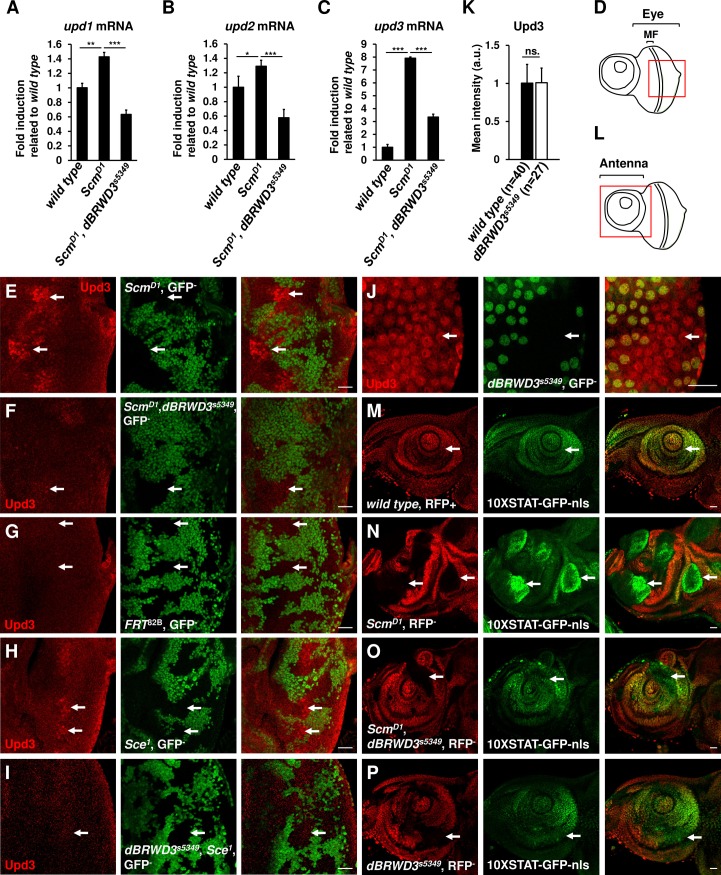
Fig 3. dBRWD3 suppresses ectopic expression of upd and activation of the JAK-STAT pathway.
(A-C) The upd1 (A), upd2 (B), and upd3 (C) mRNA levels of mosaic eye brain complexes isolated from wild type, ScmD1, and ScmD1, dBRWD3s5349 as indicated. Data are shown as means ± S.D. *, **, *** indicate P<0.01, 0.001, 0.0001 respectively by Student's t-test, n = 4. (D) A schematic illustration of a 3rd instar eye imaginal disc. MF stands for morphogenic furrow. The red square indicates the region examined in the following experiments. (E-I) Upd3 levels (arrows) in ScmD1 mutant clones (E), ScmD1, dBRWD3s5349 double-mutant clones (F), wild-type clones (G), Sce1 mutant clones (H), and dBRWD3s5349, Sce1 double-mutant clones (I) generated in 3rd instar eye imaginal discs by ey-flp and marked by the absence of GFP. Scale bars indicate 50μm. (J) Orthotopic Upd3 levels (arrows) in dBRWD3s5349 mutant clones generated in 2nd instar larval imaginal eye discs marked by the absence of GFP. Scale bars indicate 50μm. (K) Quantification analyses of orthotopic Upd3 levels (arrows) in dBRWD3s5349 mutant clones. ns. indicates not significant. (L) A schematic illustration of a 3rd instar antennal imaginal disc. The red square indicates the region examined in the following experiments. (M) GFP levels (arrows) of the 10XSTAT-nls-GFP reporter in a wild-type disc. (N-P) GFP levels (arrows) of the 10XSTAT-nls-GFP reporter in ScmD1 mutant clones (N), ScmD1, dBRWD3s5349 double-mutant clones (O), and dBRWD3s5349 mutant clones (P) generated in 3rd instar antennal imaginal discs by ey-flp and marked by the absence of the ubi promoter driven mof-RFP. Scale bars indicate 50μm.

