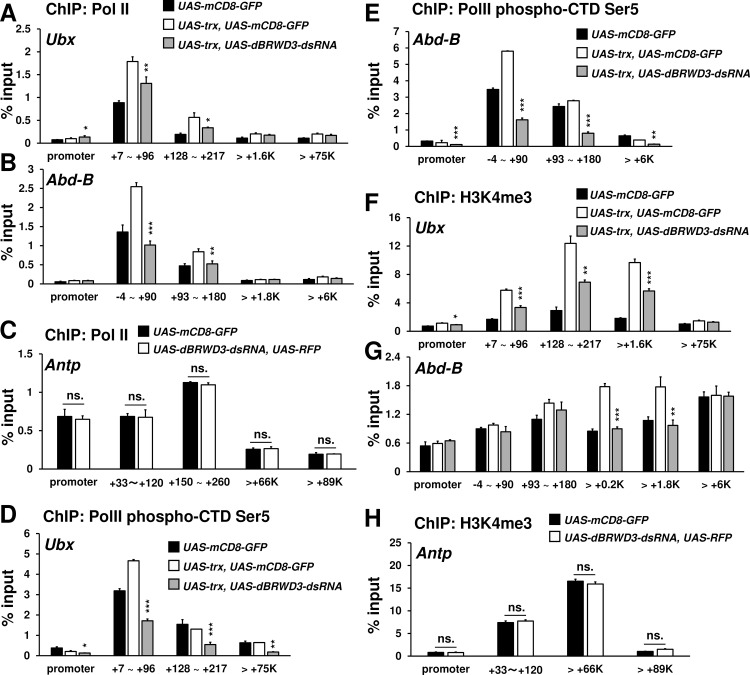
Fig 7. dBRWD3 is required for maintaining PolII and H3K4me3 levels at the 5' end of Ubx and Abd-B.
(A and B) A representative ChIP-qPCR analysis of PolII levels at Ubx (A) and Abd-B (B) in the UAS-mCD8-GFP control, in wings over-expressing trx, or in wings with concurrent trx over-expression and dBRWD3 depletion. Black asterisks indicate trx over-expression versus trx over-expression and dBRWD3 depletion. (C) A representative ChIP-qPCR analysis of PolII levels at the promoters and transcription start sites of Antp in the UAS-mCD8-GFP control and dBRWD3-depleted wings. ns. indicates not significant. (D and E) Similar to (A and B), a ChIP-qPCR analysis of PolII phospho-CTD Ser5 levels at Ubx (D) and Abd-B (E). Black asterisks indicate trx over-expression versus trx over-expression and dBRWD3 depletion. (F and G) Similar to (A and B), a representative ChIP-qPCR analysis of H3K4me3 levels at Ubx (F) and Abd-B (G). Black asterisks indicate trx over-expression versus trx over-expression and dBRWD3 depletion. (H) Similar to (C), a representative ChIP-qPCR analysis of H3K4me3 levels at the promoters and transcription start sites of Antp in the UAS-mCD8-GFP control and dBRWD3-depleted wings. ns. indicates not significant. ChIP-qPCR Data are shown as means ± S.D from 4 technical replicates. *, **, *** indicate P<0.05, 0.01, 0.001 respectively by Student's t-test.

