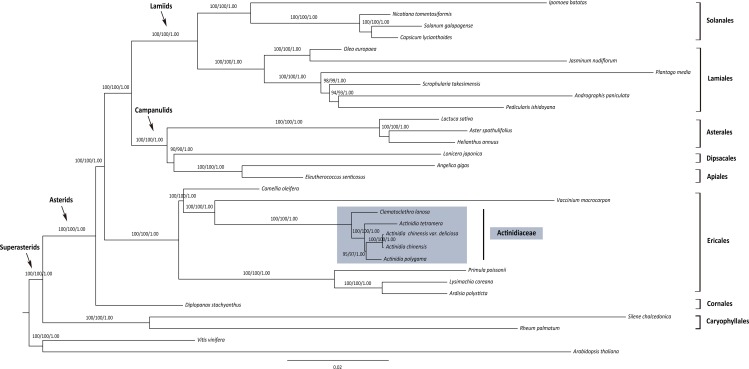
Fig 5. Maximum likelihood (ML) tree for 31 taxa based on 56 common plastid protein-coding genes (“data-complete”).
Values above the branches represent maximum parsimony bootstrap (MPBS)/maximum likelihood bootstrap (MLBS)/Bayesian inference posterior probability (PP). The Actinidiaceae lineage is indicated in shaded.

