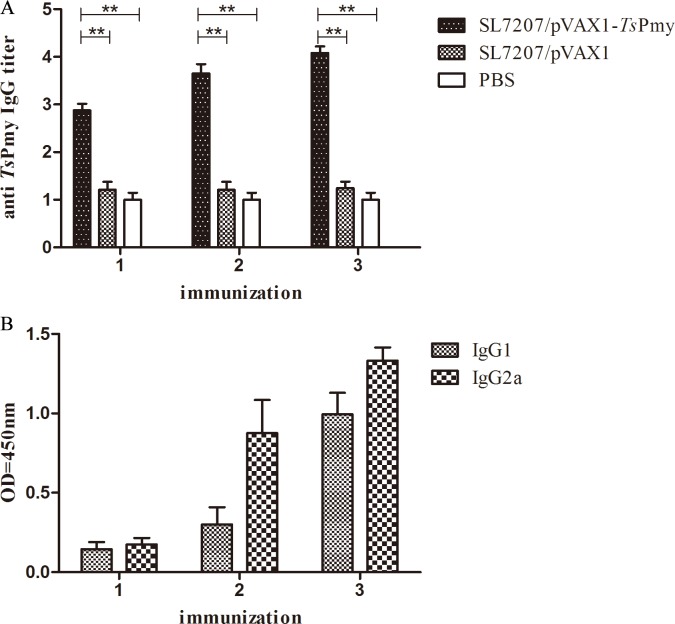
Fig 2.
Anti-TsPmy total IgG (A) and subclass IgG (B) responses in immunized mice was measured by ELISA. Sera were collected one week after each immunization. The values shown for each group are the mean ± S.D. of antibody levels. The total IgG results represent log10 endpoint values for five individual mice, and the IgG1 and IgG2a levels are shown using OD value when the sera were diluted at 1:200. Double asterisks (**) indicate statistically significant differences between two groups (p< 0.01).

