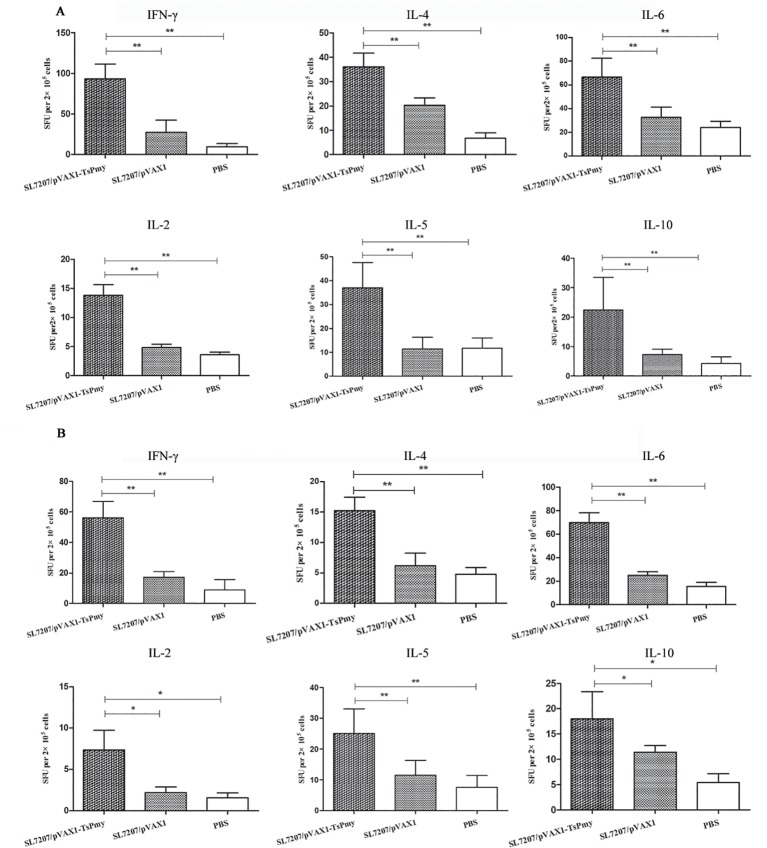
Fig 4.
Cytokine profile secreted by splenocytes (A) and MLN cells (B) upon rTsPmy stimulation. Cytokine secretion was detected by ELISPOT assays after the cells were stimulated with rTsPmy for 48 h. The number of cytokine-producing cells is expressed as SFU/2×105 cells per well after background subtraction. The results are the mean ± S.D. of cytokine levels (n = 5). Single asterisk (*) indicates significant differences (p<0.05) between two groups. Double asterisks (**) indicate significant differences (p<0.01) between two groups.

