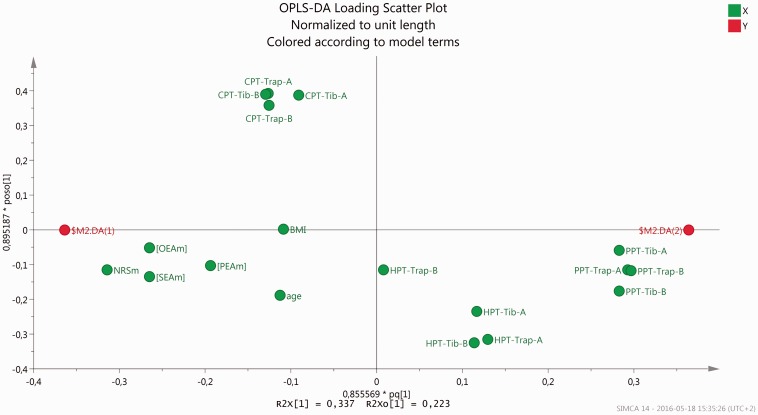
Figure 4.
Loading scatter plot of mean levels of pain intensity and of lipids ([PEAm], [OEAm],] and [SEAm]), PPT, CPT, and HPT values for trapezius (Trap) and tibialis anterior (Tib) (A = most painful/dominant side and B = least painful/non-dominant side) together with age, and BMI (these variables marked in green). $M2.DA (1) (in red) represent the predicted value for the CWP group and $M2.DA (2) (in red) for CON. The approximation to prediction values in the plot is proportional to the contribution of the normalized levels of the parameters in the model. NRS, PPTs, OEA, and SEA contribute more to the model (i.e., graphically located near $M2.DA (1) or $M2.DA (2)) than PEA, age, BMI, and thermal pain thresholds.

