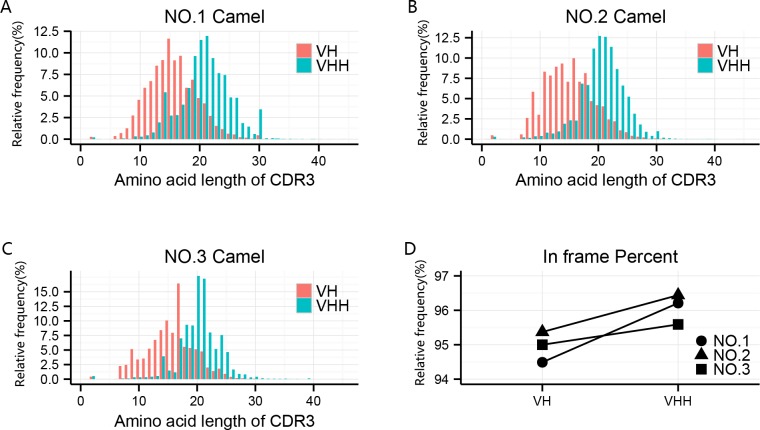
Fig 1. Schematic diagram of the CDR3 (AA)-relative analysis and in-frame percent (ORF) statistics.
a-c The CDR3-related analysis of the NO.1, NO.2, and NO.3 camels including CDR3 length (AA) and proportion; d The comparison of in-frame percent of antibody variable region genes between VH and VHH clones of three camels.

