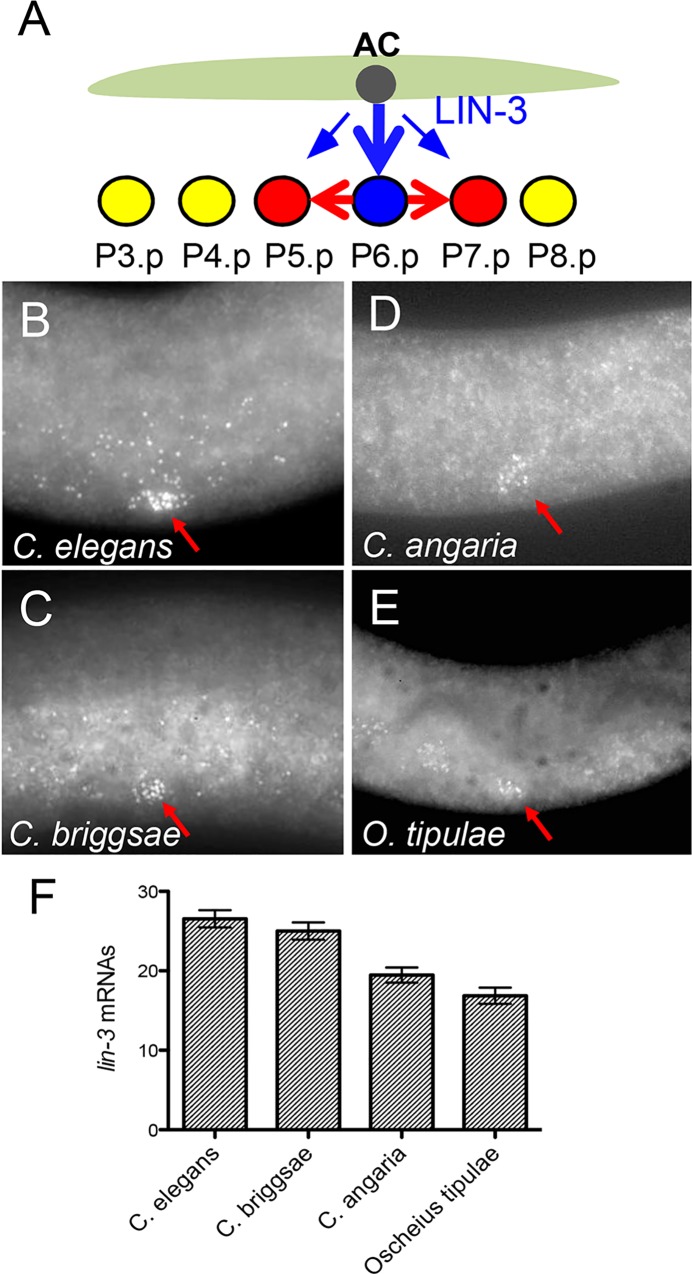
Fig 1. lin-3 expression level in the anchor cell is overall conserved in different Caenorhabditis species.
(A) Cartoon depicting the position of the anchor cell (AC) and Pn.p cells at the time of induction. Three Pn.p cells (P5.p –P7.p) are induced upon LIN-3 secretion. (B-E) smFISH using a lin-3 probe in C. elegans N2 (data from [2]) (B), C. briggsae AF16 (C), C. angaria RGD1 (D) and O. tipulae CEW1 (E). Red arrow marks the position of the anchor cell. (F) Quantification of the number of spots detected in the anchor cell of these species at the time of induction (n = 32* animals for N2, n = 24 for AF16, n = 26 for RGD1 and n = 22 for CEW1). *: these include 20 animals from [2] (see Fig 6 for an independent dataset with a similar result). The difference between C. elegans and C. briggsae is not statistically significant with a Tukey’s multiple comparison test (P value = 0.99), whereas the difference between C. elegans and C. angaria, or C. elegans and O. tipulae is significant (P values < 0.0002).

