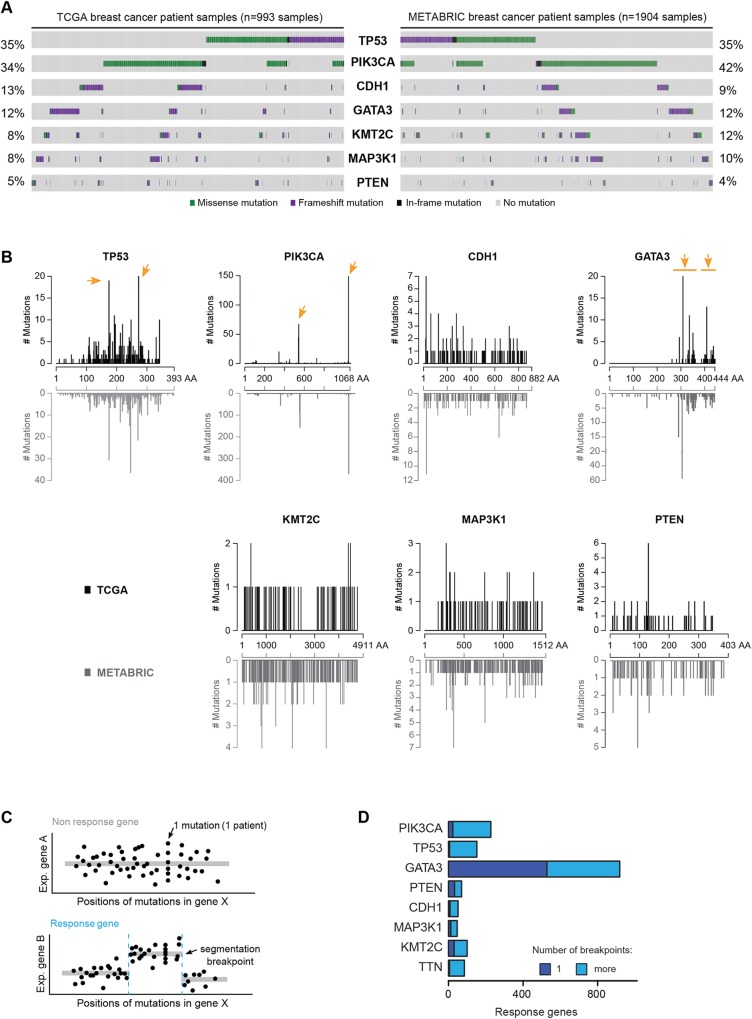
Fig 1. Breast cancer mutations are associated with domain-specific gene expression changes.
(A) The most frequently mutated breast cancer genes from the TCGA (left) and METABRIC (right) cohorts are displayed. Bars from left to right indicate individual samples coloured by mutation type. Gray indicates absence of mutation. (B) Distribution of mutations along the indicated proteins. On top (black), TCGA data; at bottom (gray), METABRIC data. Hotspots (as determined by visual inspection and literature curation) are indicated with arrows. (C) Sketch of computational detection of mutational gene segmentation. TCGA expression and mutation data feed a segmentation analysis for a gene X. On top, expression of gene A is unrelated to the position of mutations. At bottom, a relation between mutation position along gene X and expression of gene B is detected. (D) Overview of expression changes in response to mutated domains in eight commonly mutated genes (TCGA data). Response genes are genes showing a segmentation pattern. TTN was included as a control gene.

