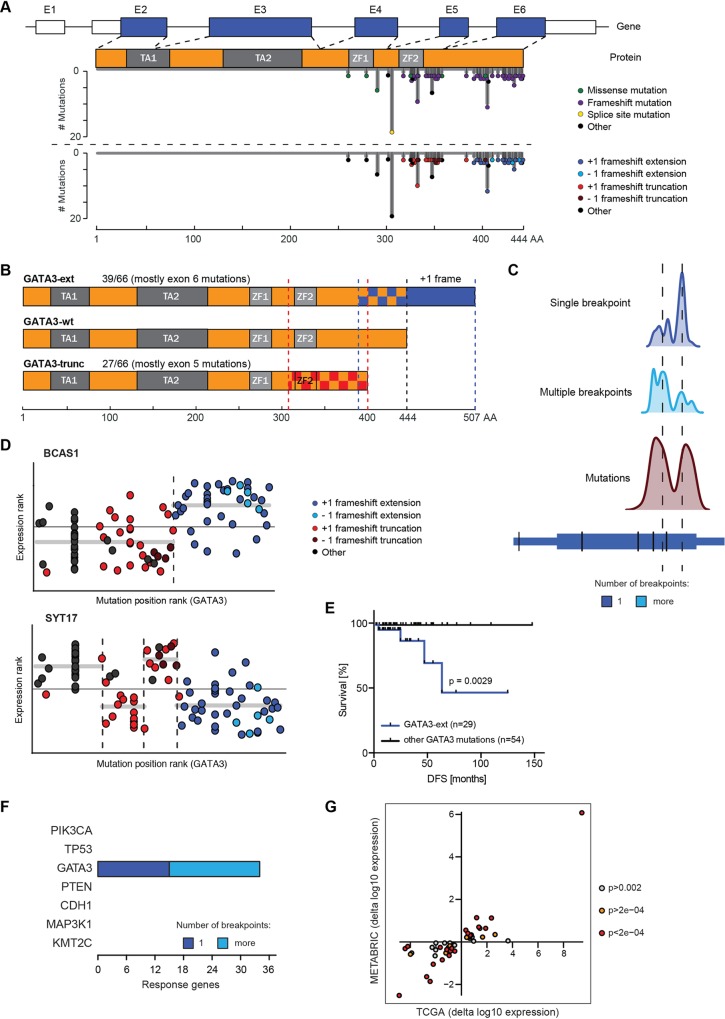
Fig 2. GATA3 mutations are non-randomly distributed and fall into functionally distinct subclasses.
(A) Schematic of GATA3 gene and protein. TCGA mutations are coloured by class and/or type of frameshift and are mapped onto gene and protein length. Indicated are exons (E1-E6) and protein domains (TA, transactivation; ZF, zinc finger). (B) Sketch of GATA3 proteins. Wild-type and the two main protein products of frameshift mutants are depicted. Frameshift mutations affect the proteins in checkered areas. The predominant C-terminal extension is displayed in blue. Frequencies of mutations in the TCGA cohort are indicated. (C) Domain analysis for GATA3. Density plots show the smoothened distributions of segmentation breakpoints (single breakpoint, top; multiple breakpoints, middle) and mutations (bottom) in relation to genomic location. (D) Association between mutation position and expression of BCAS1 and SYT17 in the TCGA cohort. Horizontal axis shows ranked position of mutations along the GATA3 gene. On the vertical axis, ranked normalised expression values are displayed. These values are then segmented as described. Mutations are coloured according to category as in (A). (E) Disease-free-survival (DFS) analysis of TCGA patients with GATA3-ext mutations vs. all other GATA3 mutation classes. P-value was calculated with Log-rank (Mantel-Cox) test. (F) Overview of response genes showing a segmentation pattern in METABRIC data. Analysis was performed on the 46-gene TCGA patient-derived GATA3-ext signature. (G) Fold changes of GATA3-ext vs. other GATA3 mutant tumours in TCGA and METABRIC for 46 signature genes. Each dot represents one gene, colouring is by p-value (Wilcoxon) in METABRIC analysis.

