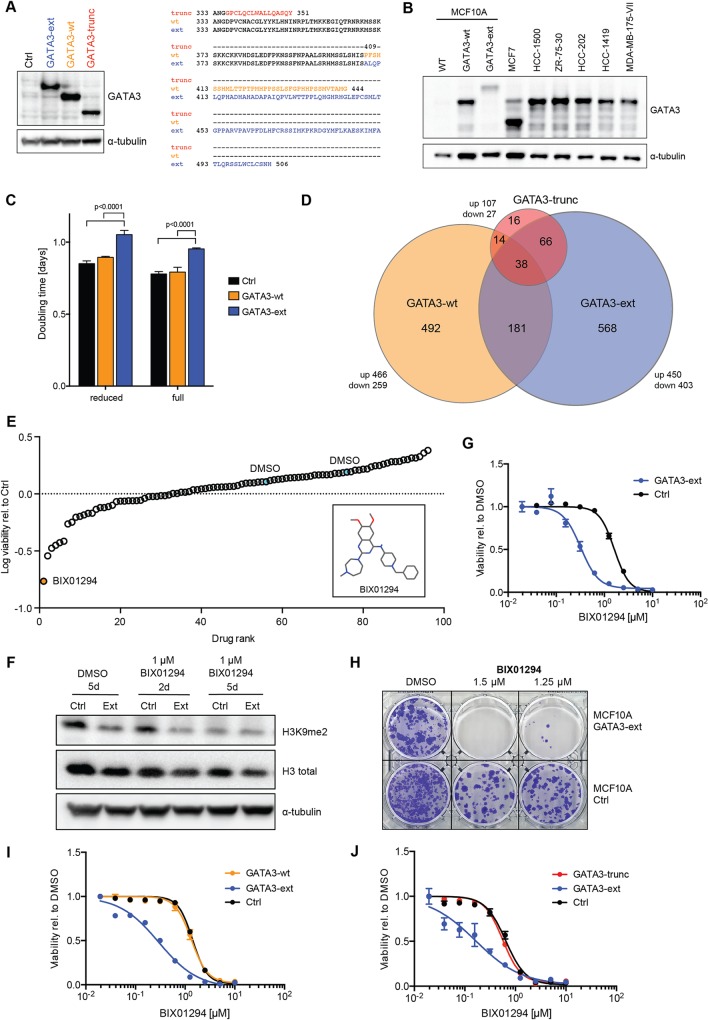
Fig 3. A GATA3 extension mutant cell line model is sensitive to G9A/GLP inhibition.
(A) Western blot shows expression of wild-type and mutant GATA3 proteins in MCF10A cells. Protein sequences of canonical and alternative C-termini are displayed. (B) Western blot shows endogenous GATA3 levels in various breast cancer cell lines in comparison to MCF10A wild-type and GATA3-ext and -wt expressing cells. (C) Doubling time of MCF10A control, GATA3-ext and -wt cells as measured over 12 days. Cells were cultured in full and reduced supplement conditions (see Materials and Methods), counted every 4 days and cumulative cell numbers and doubling times were calculated. P-values were calculated with 2-way ANOVA with Holm-Sidak’s multiple comparisons correction. (D) Differentially expressed genes and their overlap from RNA sequencing of MCF10A GATA3-wt, GATA3-ext and GATA3-trunc cells (all compared to control cells). (E) Small-molecule screen in MCF10A control and GATA3-ext cells. Cells were treated with drugs for 6 days before viability was measured. Data were median-centred and normalised to control. Top hit and negative controls (DMSO) are indicated. Inset shows the structure of BIX01294. (F) Western blot shows decrease of histone 3 lysine 9 dimethylation (H3K9me2) upon treatment of MCF10A control and GATA3-ext cells with BIX01294 for 2 or 5 days. (G-J) Dose response curves (DRC) and colony formation assay (CFA) in reduced supplement-containing medium. MCF10A control and cells expressing GATA3-ext, GATA3-wt or GATA3-trunc were treated with the indicated concentrations of BIX01294 for 4 days (DRC) or 10 days (CFA). Cell viability was measured by luminescent ATP read-out and normalised to a DMSO control (DRC) or cells were fixed and stained with crystal violet (CFA). The graphs show the mean of triplicate measurements. Error bars indicate SEM.

