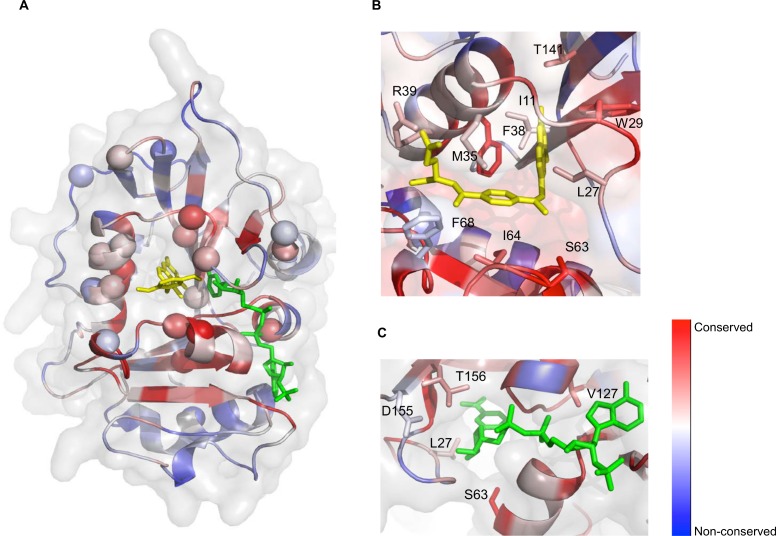
Fig 4. Mapping of the dfr1 mutations onto the yeast DFR1 model.
(A) Cartoon representation of the structural model for the yeast DFR1, colored by sequence conservation (red is conserved, blue is divergent), with surface shown in transparency. The identified resistance point mutations are indicated with a sphere. MTX is highlighted in yellow, and NADPH in green. Mutations largely cluster around conserved residues near the active site of the enzyme. The dfr1 mutations of residues interacting with MTX (yellow, B) or NADPH (green, C) are mapped onto the yeast DFR1 model. The represented protein is colored by sequence conservation as in (A).

