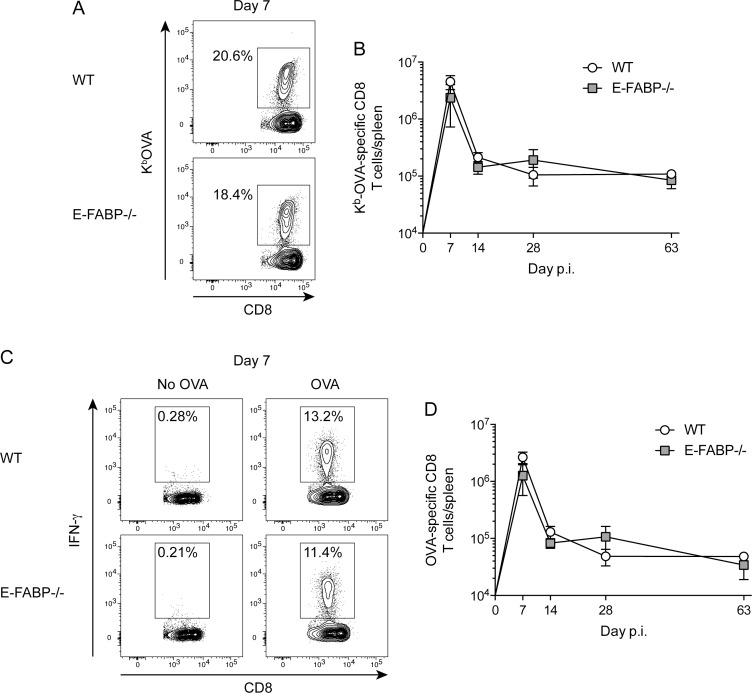
Fig 1. Kinetics of Listeria-specific CD8 T cells in WT and E-FABP-deficient mice.
WT and E-FABP-/- mice were infected with 5x10⁶ Lm-OVA. OVA-specific CD8 T cells were detected by MHC class I tetramer (Kb-OVA257-264) staining (A-B) or peptide (OVA257-264) stimulated intracellular cytokine staining for IFN-γ (C-D). (A and C) Representative contour plots showing the frequency of OVA-specific CD8 T cells, amongst all CD8+ cells, at the indicated days following infection with Lm-OVA. (B and D) Total number of OVA-specific CD8 T cells in the spleen. Data (mean±s.d.) are from 3-mice/time point/group except day 63 E-FABP-/- (n = 2). Data are representative of two independent experiments and were analyzed by the Mann-Whitney test.

