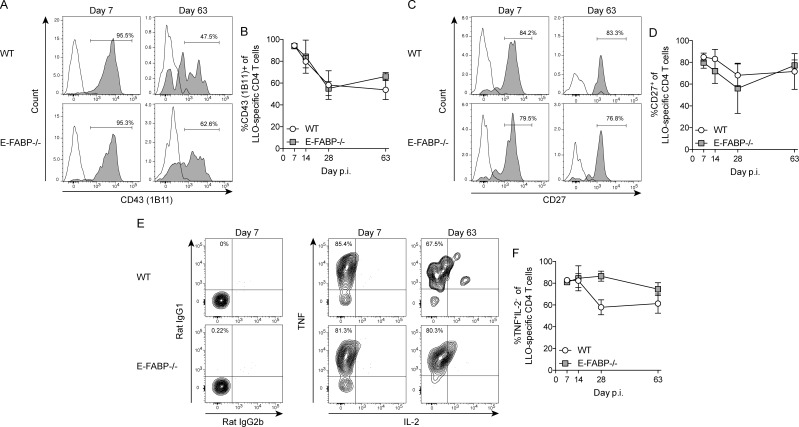
Fig 4. Phenotypic and functional characterization of Listeria-specific CD4 T cells.
(A, C, E) Representative histograms and contour plots from day 7 or day 63 showing the frequency of LLO-specific CD4 T cells that are positive for the indicated cell surface marker or cytokine. (A) Open histogram is isotype control; gray histogram is CD43 (clone 1B11). (C) Open histogram is isotype control; gray histogram is CD27. (B, D, F) Total percentage of LLO-specific CD4 T cells positive for the indicated cell surface marker or cytokine on the indicated days. Data (mean±s.d.) are from 3-mice/time point/group except day 63 WT (n = 2). Data are representative of two independent experiments and were analyzed by the Mann-Whitney test.

