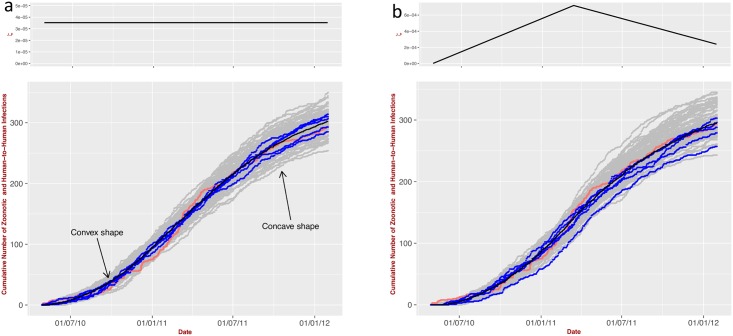
Fig 5. Application to LF.
(a) Predicted cumulative number of zoonotic and human-to-human infections (governed by ‘Poisson with Feedback’ model, Eq (12)) for constant zoonotic exposure and (b) As in (a), but exposure to zoonotic LASV is governed by an piecewise linear trend in exposure to zoonotic LASV (i.e. the piecewise zoonotic exposure ζ is linearly increasing up to March 2011 followed by a decrease up to January 2012). The parameters are optimized with the data from KGH (red line) by employing MCMC (number of iterations 50000, burning time 1000, thinning interval 1). The grey dots represent 100 independent stochastic realisations; 5 five random examples of which are visualized in blue lines. The black line represents the cumulative number of occurrences averaged over the 100 multiple stochastic realisations.

