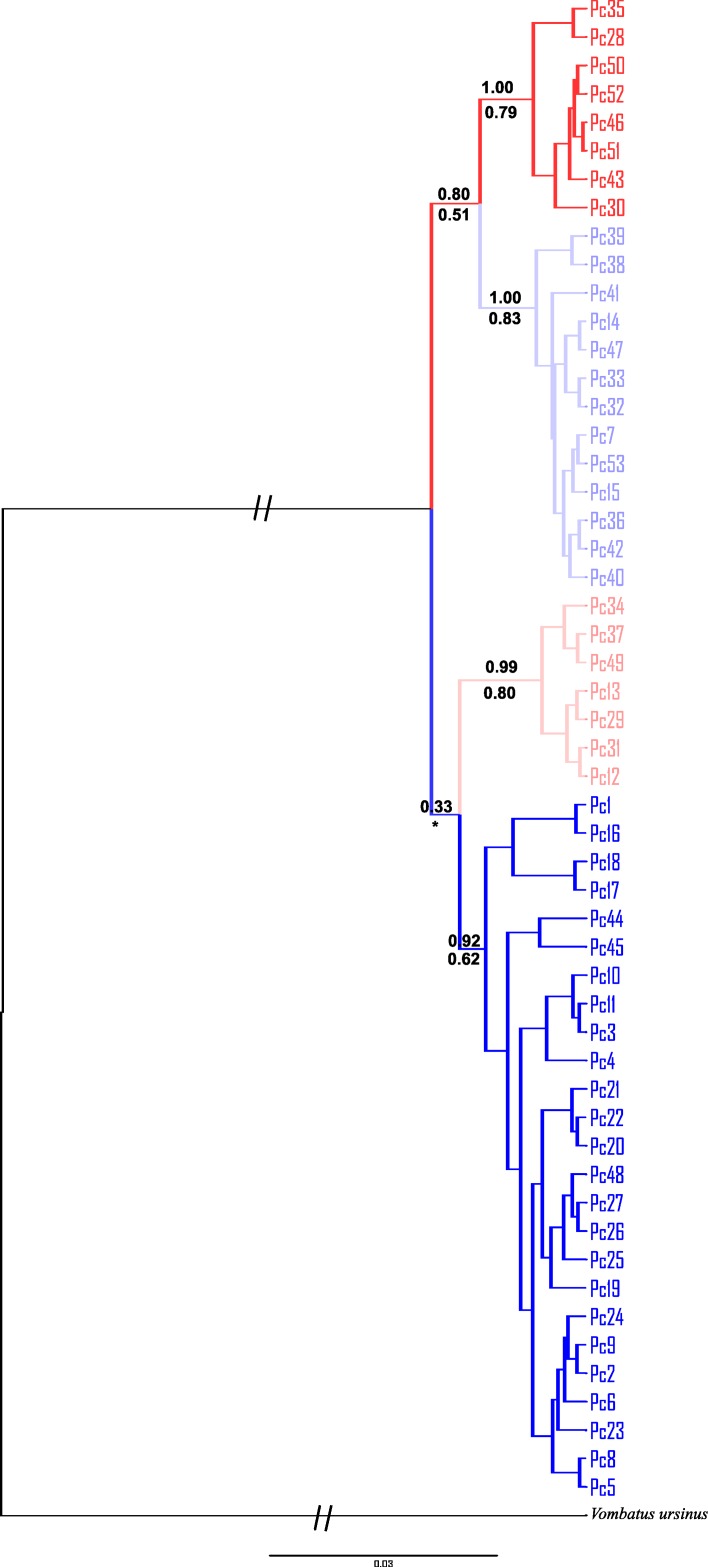
Fig 2. Phylogenetic tree showing the relationship between 53 mitochondrial DNA Control Region koala haplotypes.
The maximum credibility clade tree based on Bayesian Inference (BI) is shown, using the common wombat (Vombatus ursinus; NC_003322.1) as an outgroup. The posterior probabilities of the main branches are shown, with BI value above the line and ML below. *indicates branches not supported by ML. Red = northern lineage 1, light red = northern lineage 2, purple = central lineage, blue = southern lineage.

