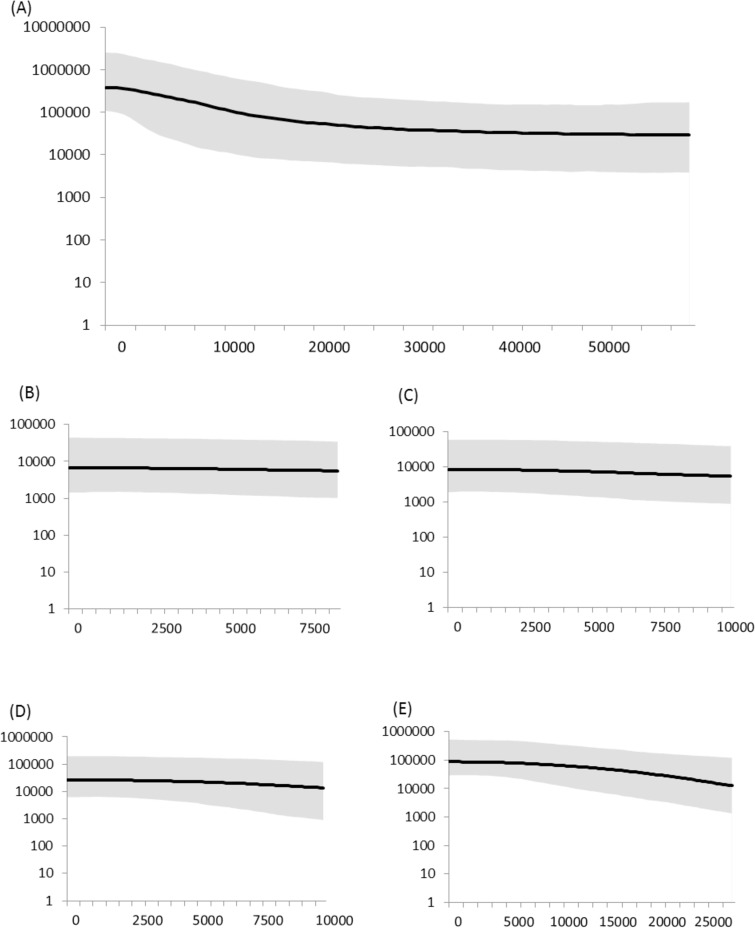
Fig 5. Bayesian skyline plots of the effective population size over time for the koala.
(A) overall, (B) northern lineage 1 (C) northern lineage 2, (D) central lineage and (E) southern lineage. Median estimates are shown as solid lines and shading represents the 95% highest posterior density intervals.

