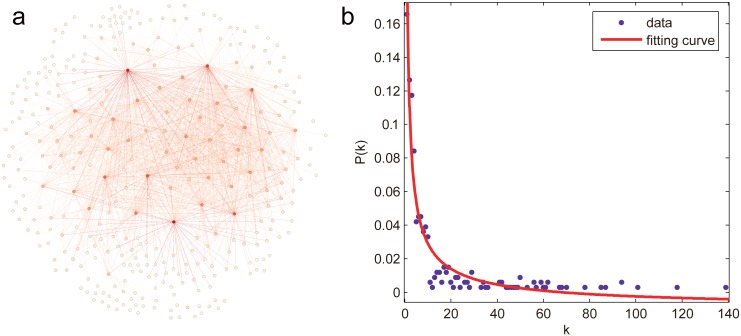
Fig 1. The USAir97 network.
(a) Its topology, in which the darkness of node color is proportional to its degree. (b) Its degree distribution, where the points represent the frequency distribution of degree, the red line denotes the fitting curve with equation P(k) = 0.1948k−0.6959−0.01029, the goodness of fit is 0.9198.

