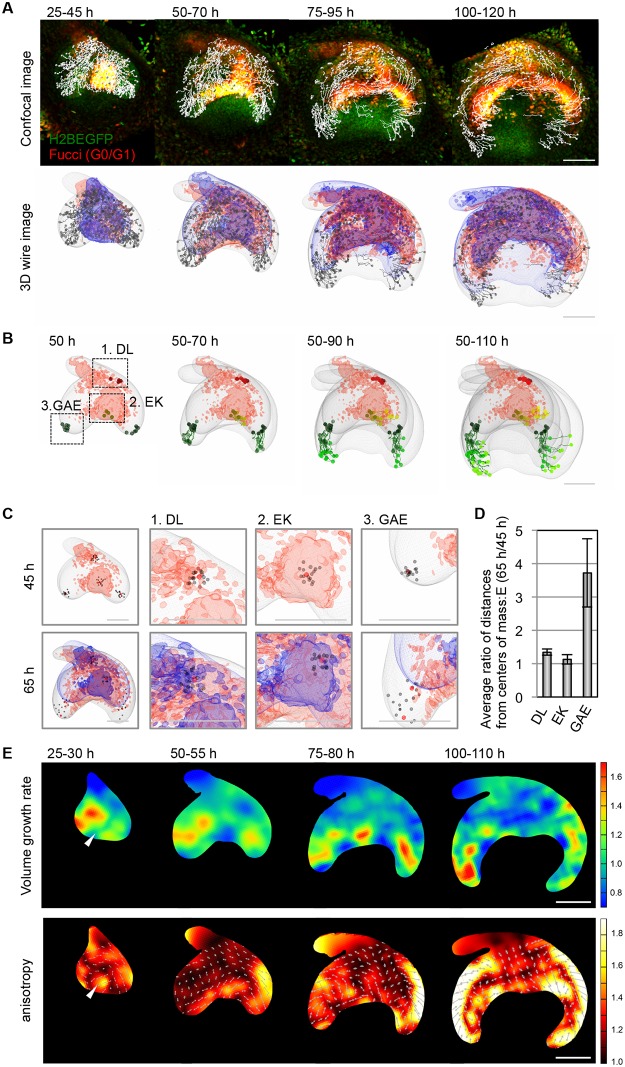
Fig 2. The quantitative kinetic analysis of tooth morphogenesis.
(A) Trajectories of epithelial cells over 20 hours (h) are shown in fluorescent images (upper panel) and wire frames (lower panel) at each time point of the long-term live image. The contours of the epithelium before and after 20 hours are shown in blue and grey wire frames, respectively. The growth-arrested regions are shown in red wire frame. (B) Trajectories of epithelial cells in parts (EK, enamel knot; DL, dental lamina; GAE, growing apex of epithelium) of the tooth germ epithelium during tooth development. (C) The changes in the relative positions of cells in parts of the tooth germ epithelium. The red and gray spots indicate the center cells and surrounding cells, respectively. (D) Measurements of the relative distances of the epithelial cells in each region. The numbers of spots for the calculations in each region were as follow: n = 17 cells (DL), n = 16 cells (EK), n = 14 cells (GAE). The error bars indicate the standard errors. (E) Deformation analysis of the epithelial tissue for 5–10 hours. The upper and lower panels show the spatial patterns of the volume growth rate and anisotropic tissue stretching, respectively. In the lower panels, the colors indicate the degree of anisotropy, and the arrows indicate the major axes of tissue stretching. The numbers of spots used to estimate the deformation map for each time intervals were as follows: n = 425 cells (25–30 hours), n = 552 cells (50–55 hours), n = 532 cells (75–80 hours), n = 615 cells (100–110 hours). The scale bars represent 100 μm.

