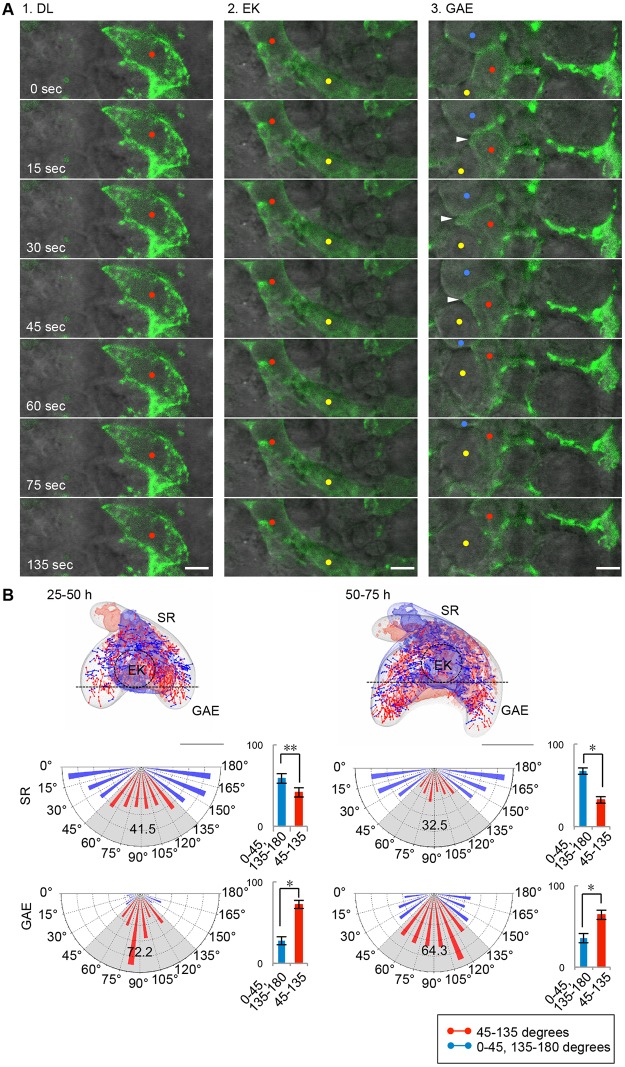
Fig 3. Coordinated behaviors of the epithelial cells during tooth morphogenesis.
(A) Time-lapse sequences of the dental lamina (DL), enamel knot (EK) and growing apex of the epithelium (GAE) regions showing cell motility. The cells randomly expressed transgenes (YFP-Actin; green). The red, yellow and blue dots indicate individual cells in each region. The arrowhead indicates a membrane protrusion extending from the cell in the GAE. The scale bars represent 5 μm. (B) Distribution and measurement of mitotic spindle orientation in the developing tooth germ. The locations and orientations of the mitotic spindles of the dividing cells are shown in the wire frames. The mean distributions of the mitotic spindle angles (θ) in stellate reticulum (SR; upper) and growing apex of the epithelium (GAE; lower) are shown in the pie chart graph. The results are shown as the mean ± s.d. of three samples (n = 557, 627 and 626 cells [SR], n = 263, 183 and 234 cells [GAE]). *P < 0.01, * * 0.001 < P < 0.005, analyzed with t-tests. The scale bars represent 100 μm.

