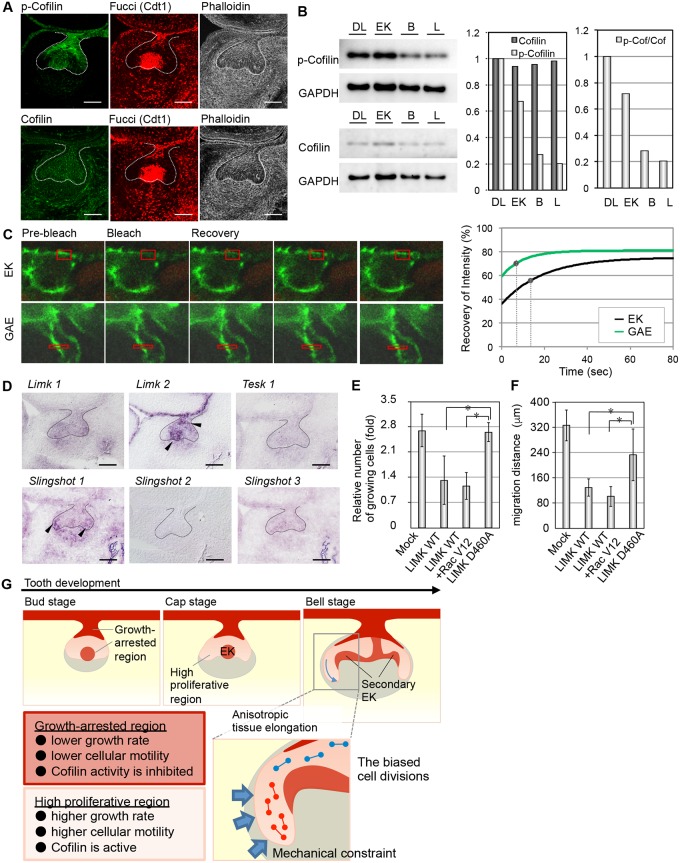
Fig 4. The regulation of the tooth morphogenesis via actin reorganization.
(A) The localizations of p-cofilin (green, left upper), cofilin (green, left lower), and F-actin (white, right) were detected by immunohistochemistry. The G0/G1 phase cells (red, center) are visualized with a Fucci probe. The lingual side is on the left in all panels. (B) Estimations of the p-cofilin/cofilin ratios in parts of the tooth germ epithelium (EK, enamel knot; DL, dental lamina; B and L, buccal side and lingual sides of the growing apex of the epithelium). The relative amounts of cofilin and p-cofilin in the regions of the epithelium were determined by immunoblotting (left). The intensities of the bands were calculated and are indicated in the bar graphs (right). (C) Measurements of actin dynamics in the epithelium using fluorescence recovery after photobleaching (FRAP). The right graph illustrates the best-fit curves of the normalized fluorescence intensity during the FRAP assay. The spots indicate the half-recovery times. (D) Gene expression of upstream molecules that regulate cofilin activity in the E14.5 tooth germ. The lingual side is on the left in all panels. The scale bars represent 100 μm. (E) Inhibition of cell proliferation by cofilin phosphorylation in a WST-8 assay. The results are presented as the mean ± s.d. of triplicate experiments. *P < 0.01, analyzed by t-test. LIMK WT, wild-type LIM-kinase (LIMK); LIMK D460A, dominant negative LIMK mutant; Rac V12, dominant active mutant of Rac1. (F) Inhibition of cell migration by cofilin phosphorylation in a wound healing assay. The bars indicate the migration distances of the epithelial cells. The results are presented as the mean ± s.d. of triplicate experiments. *P < 0.01, analyzed by t-test. (G) Schematic summarizing the observed results in this study.

