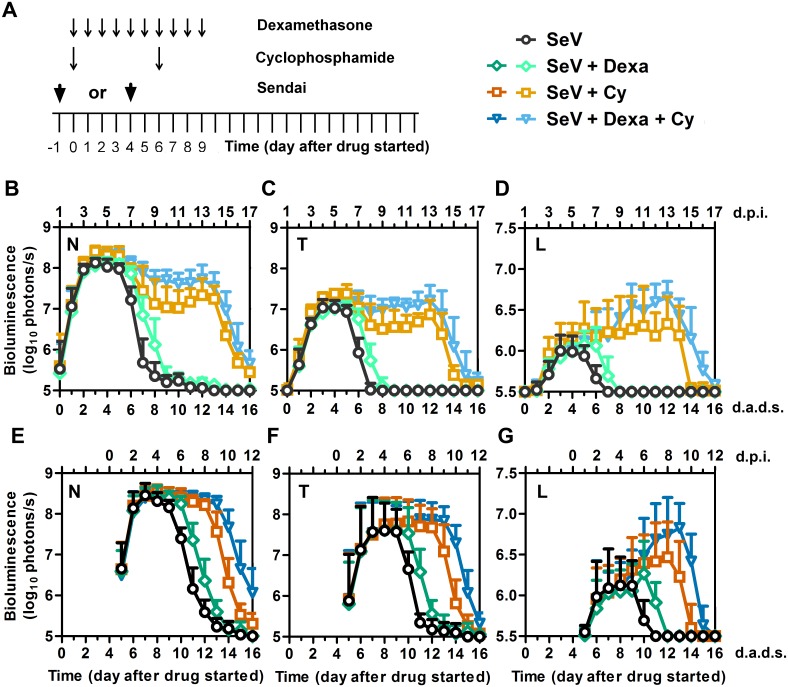
Fig 1. SeV infection measured by bioluminescence imaging in living mice after treatment with Dexa and/or Cy.
(A) Drug treatment regimen and timing of infection. Arrows denote days on which drug injections were performed or 7,000 PFU Sendai virus (SeV) was intranasally inoculated in 5 μL PBS. Bioluminescence was measured after i.p. injection of 150 mg/kg D-luciferin and imaging with a Xenogen machine. (B–D) Bioluminescence of the nasal cavity (B), trachea (C), and lungs (D) in mice inoculated 1 day before starting drug treatment. Data shown are averages of 2 independent experiments with 10 mice at each time point. (E–G) Bioluminescence of the nasal cavity (E), trachea (F), and lungs (G) in mice inoculated 4 days after starting drug treatment. The data shown are averages of 3 independent experiments with 15 mice at each time point. For panels B-G, all groups were inoculated with SeV and symbols denote the following treatment groups: PBS (black circles), Dexa (green diamonds), Cy (orange squares), and Dexa + Cy (blue triangles). Lighter symbols in panels B-D correspond to groups inoculated with SeV 1 day before drug treatment, and darker symbols in panels E-G correspond to groups inoculated with SeV 4 days after drug treatment started. Error bars represent standard deviation. d.p.i., days postinfection; d.a.d.s., days after drug started.

