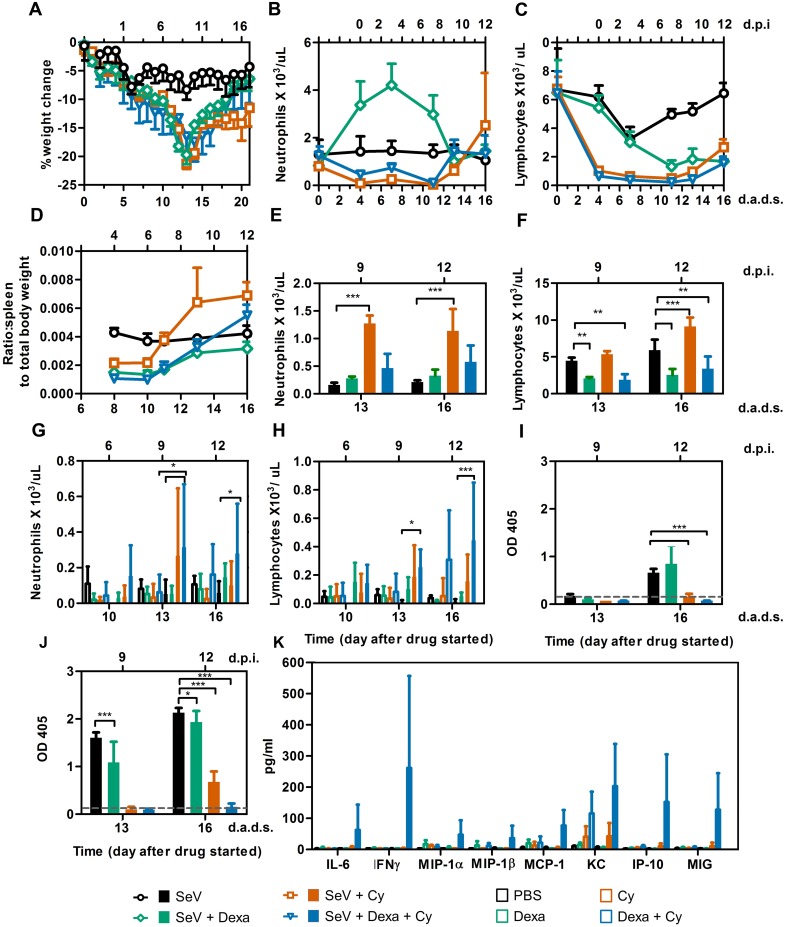
Fig 4. Immunological responses in immunosuppressed mice inoculated with SeV at 4 d.a.d.s.
(A) Percent change in starting weight. (B) Peripheral blood neutrophil counts. (C) Peripheral blood lymphocyte counts. (D) Ratio of spleen weight to total body weight. For panels A-D, groups are shown as follows: PBS (black circles), Dexa (green diamonds), Cy (orange squares), and Dexa + Cy (blue triangles). (E) Splenic neutrophil counts. (F) Splenic lymphocyte counts. (G) BALF neutrophil counts. (H) BALF lymphocyte counts. (I and J) SeV-specific IgG levels in the BALF (I) and serum (J) of mice infected with SeV 4 days after treatment with Dexa and/or Cy. (K) Chemokines/cytokines in the BALF of SeV-infected mice at 12 d.p.i. (16 d.a.d.s). For panels E-K, bars are colored as follows: PBS (black), Dexa (green), Cy (orange), and Dexa + Cy (blue). The data shown are a representative of 2 independent experiments with 3 to 5 mice in each group. Error bars represent standard deviation. d.p.i., days postinfection; d.a.d.s., days after drug started. Statistics: 2-way ANOVA; *P < 0.05, **P < 0.01, ***P < 0.001.

