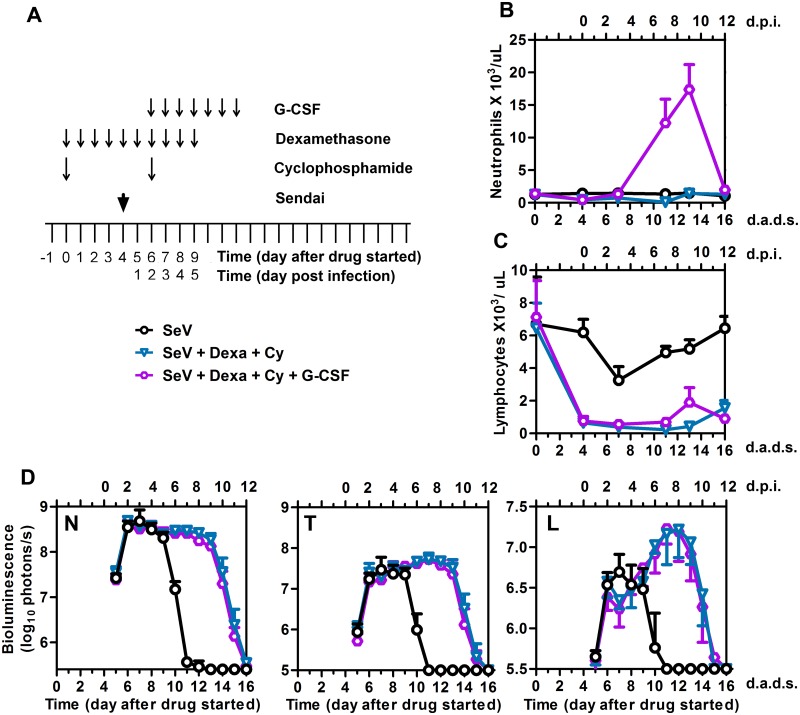
Fig 6. Effect of granulocyte-colony stimulating factor (G-CSF) on viral clearance.
(A) Drug treatment regimen with G-CSF. Arrows denote days on which G-CSF was i.p. injected, drug injections were performed, and 7,000 PFU Sendai virus (SeV) was intranasally inoculated in 5 μL PBS. (B) Peripheral blood neutrophil counts. (C) Peripheral blood lymphocyte counts. (D) Bioluminescence in the nasopharynx (N), trachea (T), and lungs (L). Groups include PBS (black circles), Dexa + Cy (blue triangles), and Dexa + Cy + G-CSF (purple circles). The data shown are a representative of 2 independent experiments with 5 mice per group. In all graphs, error bars represent the standard deviation. d.p.i., days postinfection; d.a.d.s., days after drug started.

