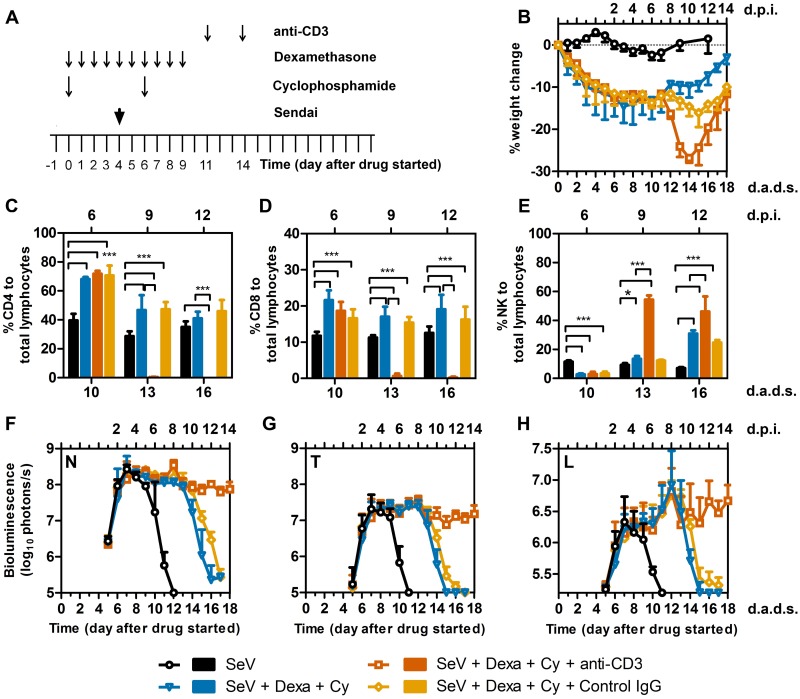
Fig 9. Effect of anti-CD3 (anti-T cell) antibody on viral clearance.
(A) Drug treatment regimen with anti-CD3 antibody. Arrows denote days on which anti-CD3 or isotype control IgG were i.p. injected, drug injections were performed, and 7,000 PFU SeV was intranasally inoculated in 5 μL PBS. (B) Percent change in starting weight. (C-E) Percentages of (C) CD4+ T cells (D) CD8+ T cells, and (E) NK cells in peripheral blood. (F-H) Bioluminescence in the nasopharynx (F), trachea (G), and lungs (H). Groups include PBS (black bars and circles), Dexa + Cy (light blue bars and triangles), Dexa + Cy + anti-CD3 (burnt orange bars and rectangles), control IgG (orange bars and diamonds). The data shown are averages of 5 mice per group. In all graphs, error bars represent the standard deviation. d.p.i., days postinfection; d.a.d.s., days after drug started. * p < 0.05, *** p < 0.001.

