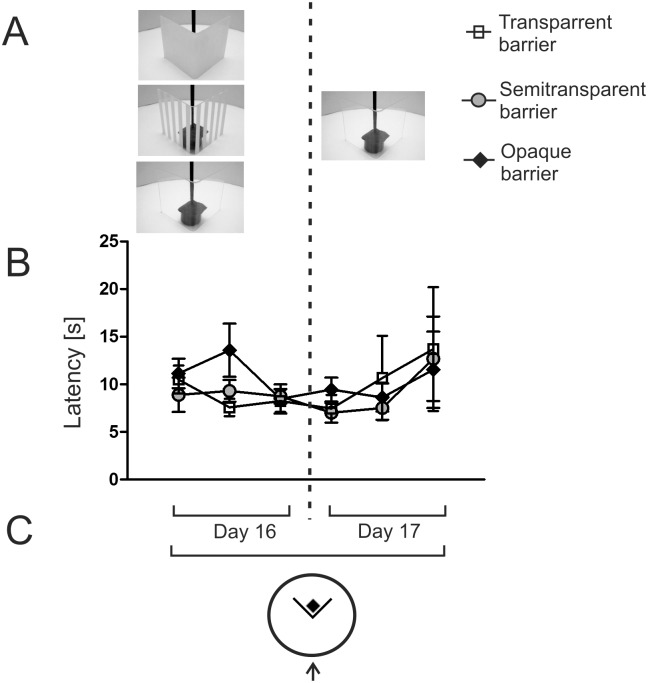
Fig 2. Effect of the previous experience with different barriers on the ability to detour the transparent barrier.
Animals that were used in the first part of the experiment (Fig 3) were retrained to detour the same kind of barrier as previously (left side) and next were tested with the transparent barrier (right side). A—picture of opaque, semitransparent and transparent barrier together with the escape platform. B—latency to reach the platform placed behind the barrier. C—diagram presenting the experimental design. The arrow shows the starting point. Values are presented as mean ± SEM.

