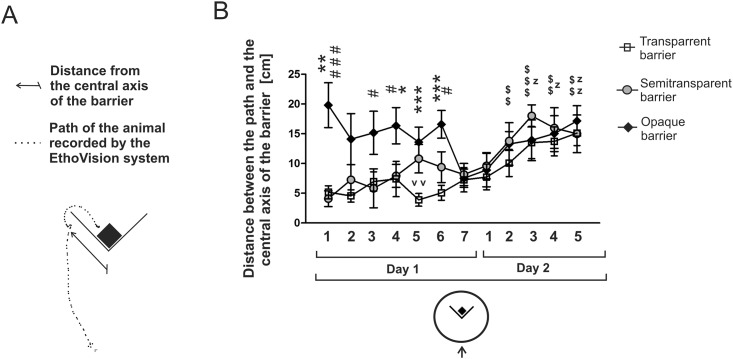
Fig 5. Distance between the animal’s path and the central axis of the barrier during the initial approach to the target.
A—diagram presenting measurement of the distance. B—data obtained during the first two days of the experiment (inward detour trials). * = P < 0.05, ** = P < 0.01, *** = P < 0.001—denotes significant differences between the opaque and transparent group; # = P < 0.05, ### = P < 0.001—denotes significant differences between the opaque and semitransparent group; v v = P < 0.01—denotes a significant differences between the transparent and semitransparent group; z = P < 0.05, zz = P < 0.01—denotes significant change in the transparent group compared with the first trial (day 1); $ $ = P < 0.01, $ $ $ = P < 0.001—denotes significant differences in the semitransparent group compared with the first trial (day 1). Values are presented as mean ± SEM.

