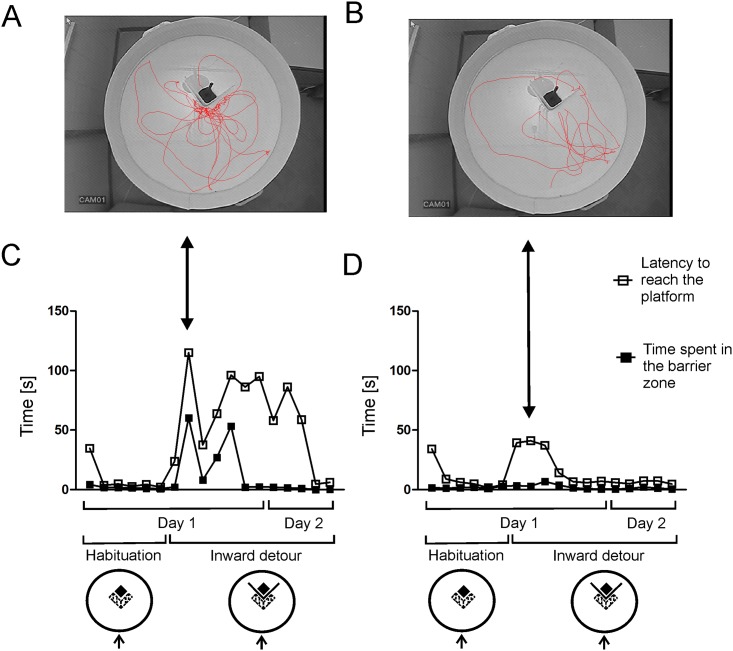
Fig 6. Individual performance of the mice from the transparent group.
A and B show tracks of mice displaying a high and low level of perseveration, while C and D shows overall performance of these mice. Large arrows mark data collected from the same mice and identify detour trials depicted in panel A and B, small arrows show the starting point, a hatched area depicts the barrier zone.

