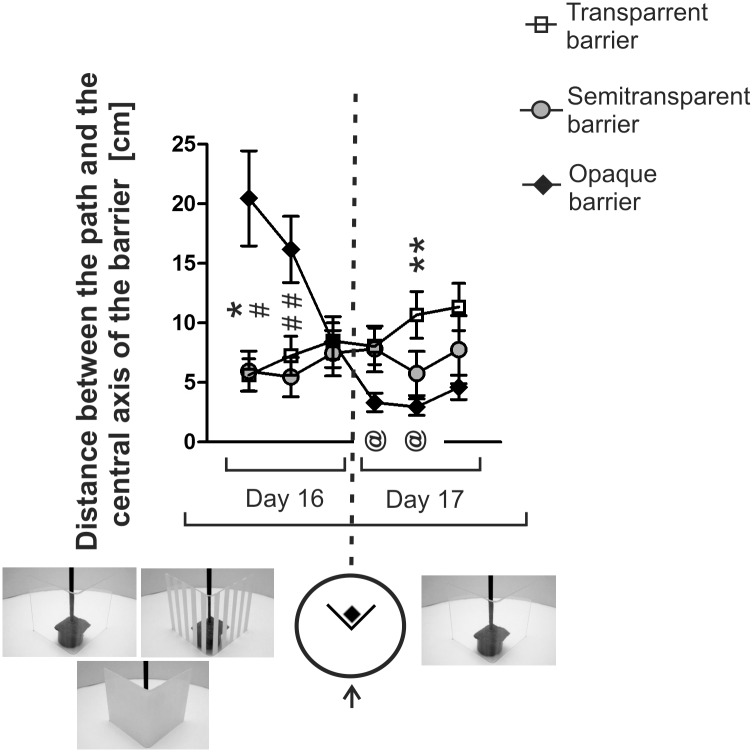
Fig 7. Distance between the animal’s path and the central axis of the barrier during initial approach to the target in animals retrained after the rest period (left side) and next tested exclusively with the transparent barrier (right side).
* = P < 0.05, ** = P <0.01—denotes significant differences between the opaque and transparent group for a given trial; # = P < 0.05, ## = P < 0.01—denotes significant differences between the opaque and semitransparent group; @ = P < 0.05—denotes a significant change in the opaque group compared with the last trial of the retraining phase. Values are presented as mean ± SEM. For more explanations see Fig 5.

